
Figure 5.
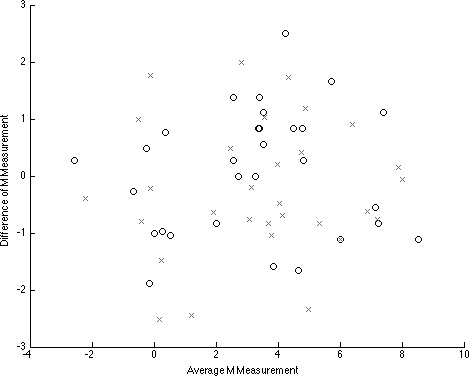
The average M measurement (mm) was plotted against the difference to demonstrate intraexaminer “o” (T1-T2) and interexaminer “x” (T1-TGK) reliability.
Official websites use .gov
A
.gov website belongs to an official
government organization in the United States.
Secure .gov websites use HTTPS
A lock (
) or https:// means you've safely
connected to the .gov website. Share sensitive
information only on official, secure websites.
The average M measurement (mm) was plotted against the difference to demonstrate intraexaminer “o” (T1-T2) and interexaminer “x” (T1-TGK) reliability.