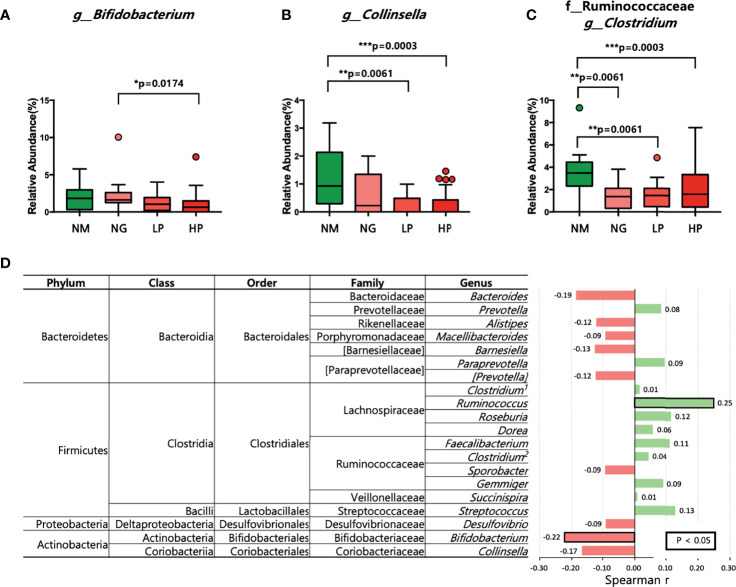
Figure 2.
Microbial composition at the genus level in patients with different RF levels. (A–C) Comparison of the relative abundance of (A) Bifidobacterium, (B) Collinsella, and (C) Clostridium using the Kruskal–Wallis test. (D) Correlations between the relative abundance of each of the 20 most abundant genera and RF levels. Positive correlations are shown in green, and negative correlations are shown in pink. The numbers in bold indicate statistically significant correlations (p < 0.05). *p < 0.05; **p < 0.01; ***p < 0.001. NM, normal control; NG, RA patients showing 20 or less of RF level; LP, RA patients showing over 20 and not exceeding 60 of RF level; HP, RA patients showing over 60 of RF level.

