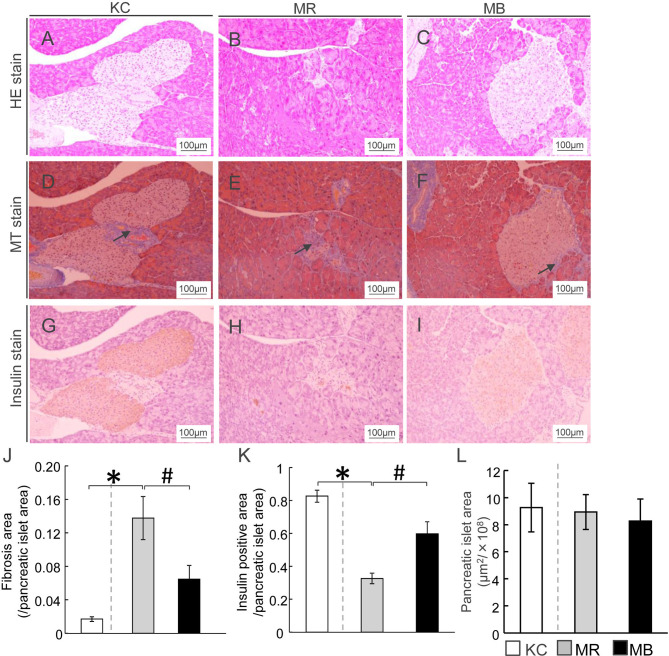
Figure 1.
β-Cell area in mice after 10 weeks of experimental diet intake. (A–C) Representative histological hematoxylin-eosin staining of pancreatic sections from mice from each of the three experimental groups. (D–F) Fibrotic areas in the pancreas within the islets were stained blue after Masson’s trichrome staining (arrows). (G–I) Insulin-positive areas within the islets are stained brown (scale bar, 100 µm). Ratio of areas with fibrosis (J) and insulin-positive cells (K) in the pancreatic islets and area of pancreatic islets (L). MB, minimum essential medium (MEM) mice on a barley diet; MR, MEM mice on a rice diet; KC, potassium simplex optimized medium control mice on a rice diet. Data are expressed as the mean ± SEM for 8–12 animals. Data were analyzed using Student’s t-test. *P < 0.05 compared with the KC group; # P < 0.05 compared with the MR group.

