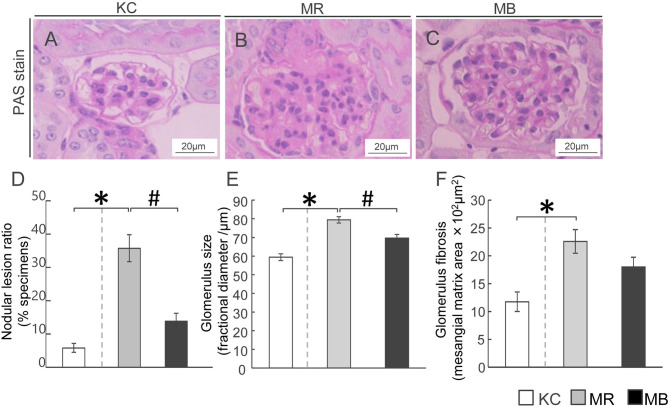
Figure 2.
Histopathology showing fibrosis and pathogenesis in the kidneys of mice after 10 weeks of experimental diet intake. (A–C) Glomerular fibrosis observed using Periodic acid–Schiff staining (scale bar, 20 µm) in mice from the three groups. (D–F) Quantification of the nodular lesion ratio (D), glomerular size (E), and fibrotic area (F). MB, minimum essential medium (MEM) mice on a barley diet; MR, MEM mice on a rice diet; KC, potassium simplex optimized medium control mice on a rice diet. Data are expressed as the mean ± SEM for 8–12 animals. Data were analyzed using Student’s t-test. *P < 0.05 compared with the KC group; # P < 0.05 compared with the MR group.

