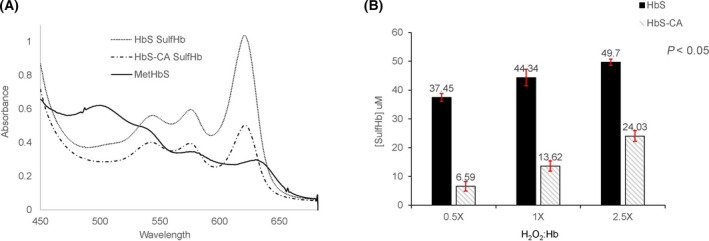
Fig. 1.

Spectral analysis of H2O2 oxidation of metHbS. Absorbance spectra were recorded before and after addition of 2 mm Na2S to 60 μm metHbS and 60 μm metHbS treated with 300 μm CA in the presence of 150 μm H2O2. Panel A shows the difference in the amount of sulfheme concentration in the presence and absence of CA. Panel B shows sulfheme concentration versus different H2O2 ratios to Hb. Error bars represent standard deviation.
