Fig. 3.

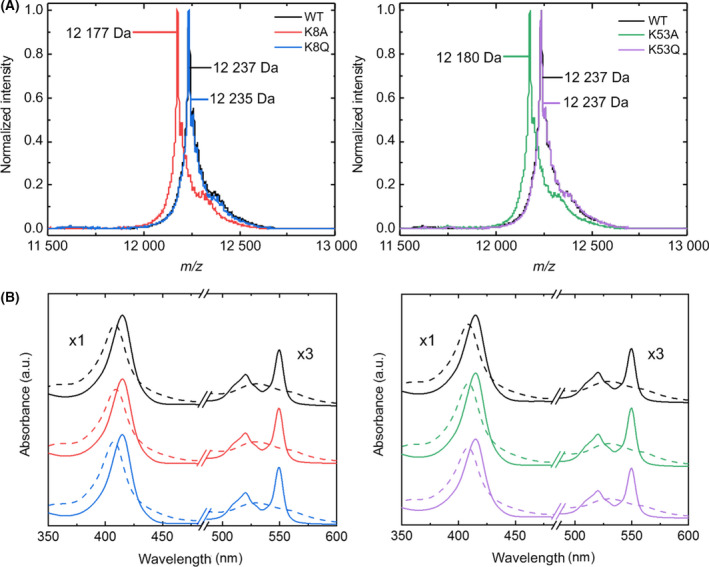
Mass and visible absorption spectra of WT and mutant species of cytochrome c. (A) MALDI‐TOF spectra of WT and Cc mutants. The molecular mass of WT, K8Q, and K53Q Cc is 12 235 Da, whereas that of K8A and K53A Cc is 12 179 Da. (B) Visible absorption spectra of oxidized (dashed line) and reduced (solid line) Cc in the presence of potassium ferricyanide and sodium ascorbate, respectively. The color code is the same as in panel (A). a.u., arbitrary units.
