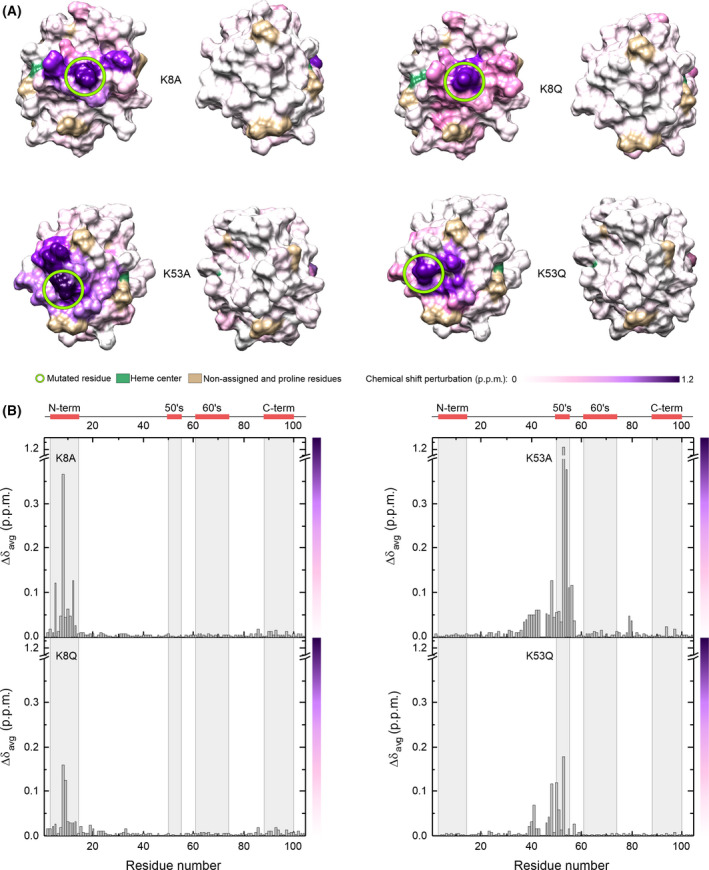
Fig. 5.

NMR chemical shift perturbations of reduced cytochrome c mutants. (A) Each surface map shows residues colored according to CSPs calculated previously from 2D 1H‐15N HSQC spectra of reduced K8A, K8Q, K53A, and K53Q Cc with respect to the 2D 1H‐15N HSQC spectra of reduced WT Cc. (B) Plot of NMR CSPs of reduced Cc mutants. CSP values as a function of residue number calculated from 2D 1H‐15N HSQC spectra of reduced K8A, K8Q, K53A, and K53Q Cc with respect to the 2D 1H‐15N HSQC spectrum of reduced WT Cc. The color bar represents the color scale used in panel A.
