
Fig. 6.
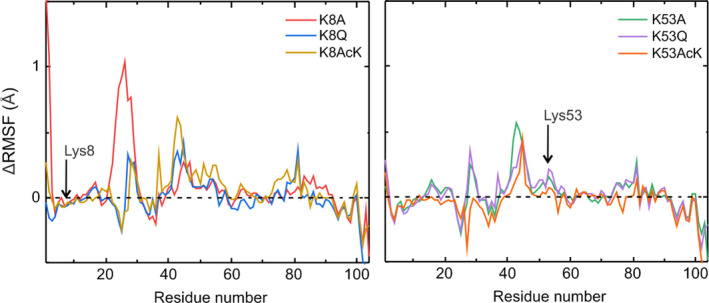
Simulation of molecular fluctuations in cytochrome c species. Comparison of the ∆RMSF of reduced K8A, K8Q, K8AcK, K53A, K53Q, and K53AcK mutants with respect to reduced WT Cc over the last 50 ns of their respective MD trajectories.
Official websites use .gov
A
.gov website belongs to an official
government organization in the United States.
Secure .gov websites use HTTPS
A lock (
) or https:// means you've safely
connected to the .gov website. Share sensitive
information only on official, secure websites.
Simulation of molecular fluctuations in cytochrome c species. Comparison of the ∆RMSF of reduced K8A, K8Q, K8AcK, K53A, K53Q, and K53AcK mutants with respect to reduced WT Cc over the last 50 ns of their respective MD trajectories.