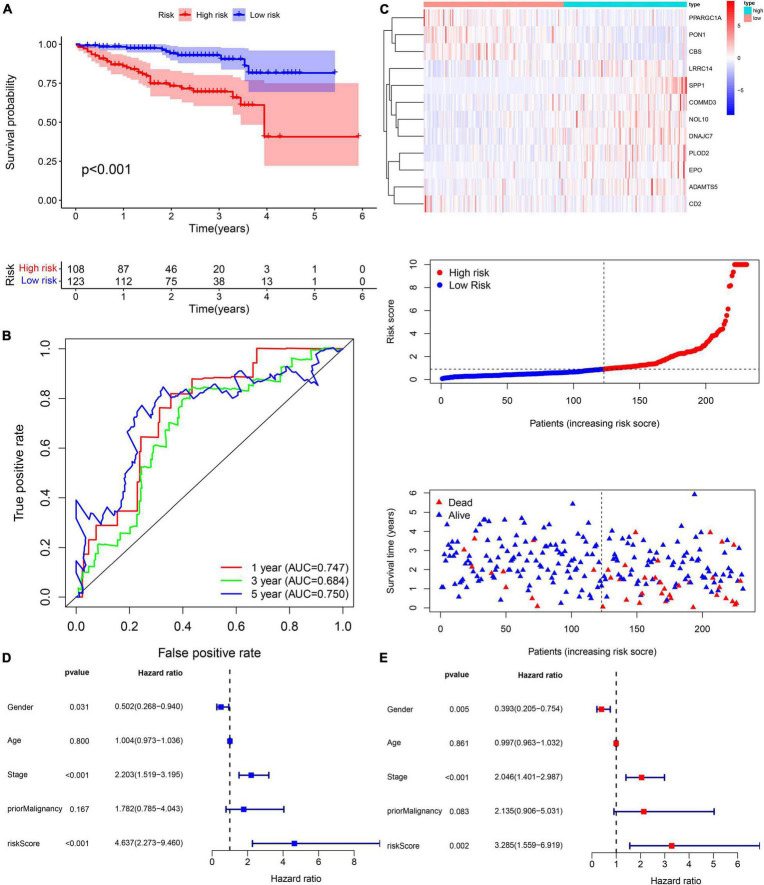
FIGURE 12.
External validation of the risk score in the ICGC cohort. (A,B) The Kaplan–Meier survival analysis and the time-dependent ROC analysis for the risk score in predicting the OS of patients in the ICGC cohort. (C) The heatmap, risk score distribution, and survival status of patients in the ICGC cohort. (D) The forest plot of univariate Cox analysis. (E) The forest plot of multivariate Cox analysis.

