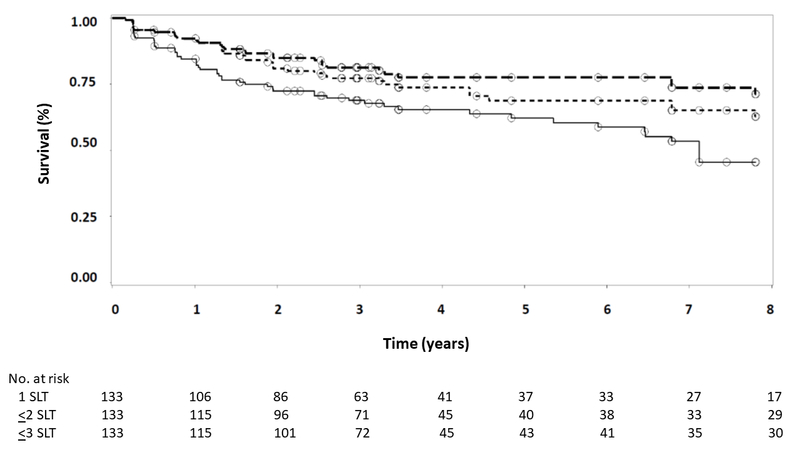
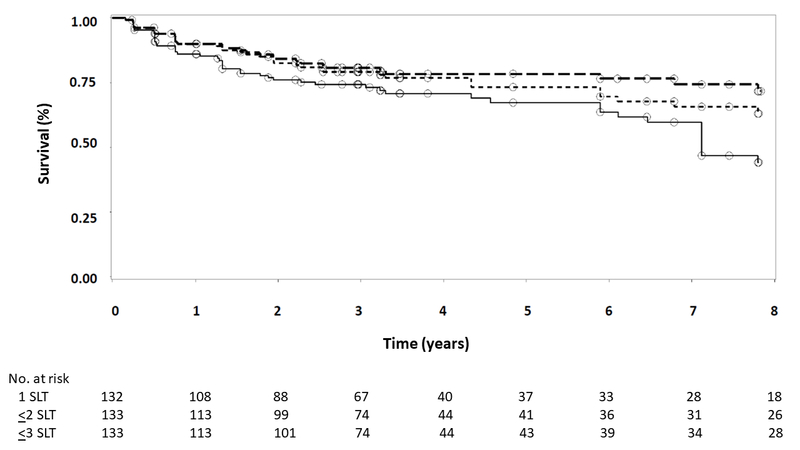
Figure 2.


Kaplan-Meier survival analysis for right eyes (A) and left eyes (B). Failure was defined as IOP exceeding target IOP on 2 consecutive visits. Solid line represents initial SLT only; short dashed line represents up to 2 SLT treatments; long dashed line represents up to 3 SLT treatments. Circles indicate censored observations.
