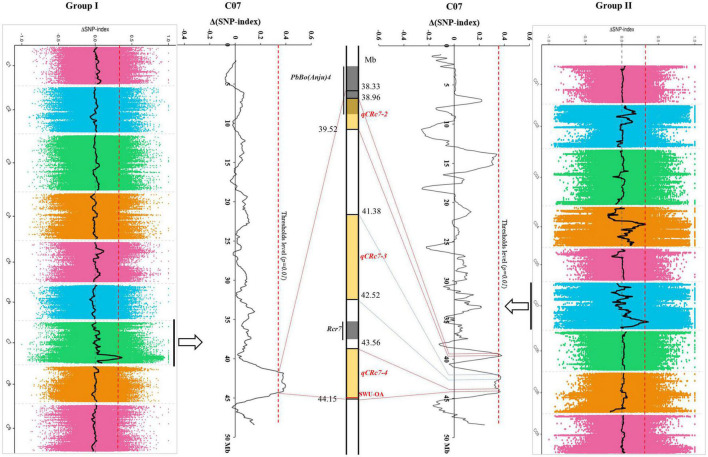
FIGURE 2.
Comparison of clubroot resistance (CR)-quantitative trait loci (QTLs) identified by QTL-sequencing (QTL-seq) from group I (left) and group II (right). The physical map of chromosome C07 (partial) was presented in the middle, with yellow backgrounds indicating QTLs identified in this study and gray backgrounds indicating loci identified in other studies.

