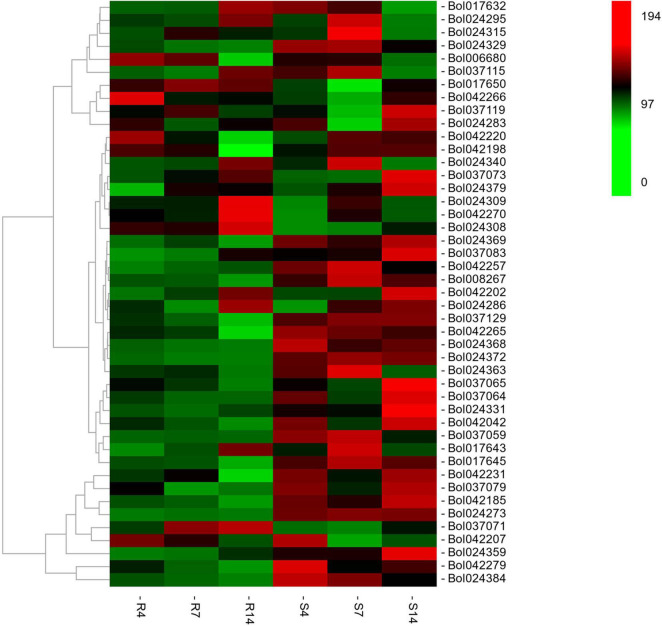
FIGURE 3.
The heatmap analysis of the expression of 46 differentially expressed genes (DEGs) underlying the CIs of qCRc4-1, qCRc7-2, qCRc7-3, and qCRc7-4. The average expression values of genes in different inoculation times were denoted at the right with a color scale, in which green, black, and red color indicated the low, medium, and high level of expression, respectively.

