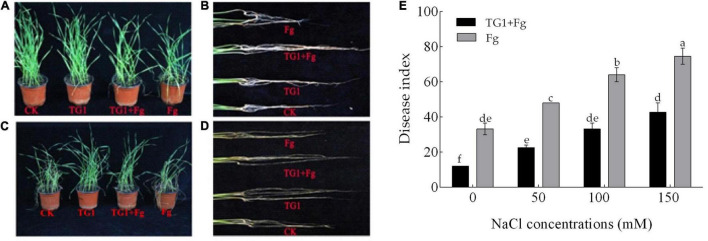
FIGURE 6.
Effect of T. longibrachiatum (TG1) on wheat seedling disease index at 28 days after inoculation under F. pseudograminearum (Fg) and different NaCl stress. Panels (A,B) represent treatments without NaCl; (C,D) represent treatments with 150 mM of NaCl stress; and (E) represents the disease index across the four NaCl concentrations (0, 50, 100, and 150 mM). Small bars represent the standard errors of the means. Different lower case letters indicate significant differences at P < 0.05 in Duncan’s multiple range test using two-way ANOVA. The treatments are detailed in the footnote of Figure 5.

