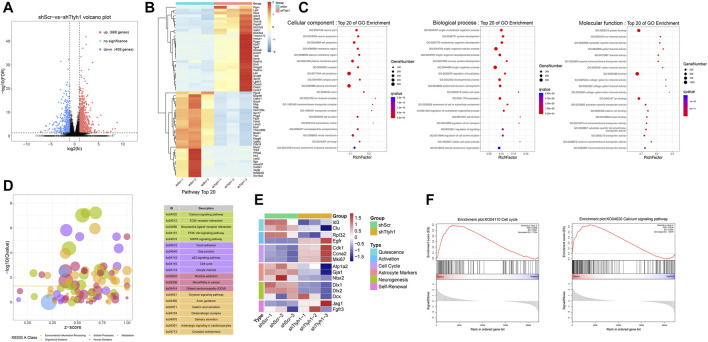
FIGURE 6.
Transcriptome sequencing results after Ttyh1 knockdown indicate involvement of Calcium signaling and cell cycle genes. (A) Differential gene volcano plot. Red dots represent 998 up-regulated genes, and blue dots represent 409 down-regulated genes. We used false discovery rate (FDR) < 0.05 and fold change ≥2 as criteria to screen for genes with significant differences. (B) Heatmap of the top 30 genes with the most significant difference in up-regulation and down-regulation, respectively. Among them, cell cycle gene Ccnd1 (Cyclin D1) was significantly up-regulated in the Ttyh1 knockdown group. (C) Gene Ontology (GO) analysis. Colors represent q values on a log scale (with red corresponding to the most highly significant). Node size represents the number of genes in a category. Top 20 items of q value are listed.(D) KEGG pathway analysis. The vertical coordinate is −log10 (q value), and the horizontal coordinate is Z-score value (the proportion of the difference between the number of up-regulated genes and the number of down-regulated genes in the total differential genes), and the yellow line represents the threshold of p = 0.05. On the right is a list of signal pathways with the top 20 p-values, with Calcium signaling mostly significant. Different colors represent different categories. Green represents environmental information processing, purple represents cellular processes, red represents human diseases, yellow represents organismal systems, and blue represents metabolism. (E) Heatmap of stage-specific markers of NSCs between control and Ttyh1 knockdown groups. (F) GSEA (gene set enrichment analysis). After Ttyh1 knockdown, calcium signaling pathway and cell cycle related genes were interfered.

