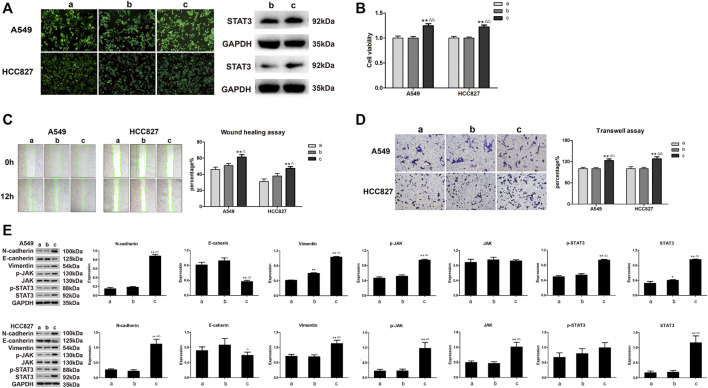
FIGURE 8.
The effects of STAT3-OE for A549 and HCC827 cells on LC cells were opposite to those being performed with AETW. (A) Expressions of stable transduced cell lines. (B) Quantitative analyses of A549 and HCC827 cell viabilities by the CCK-8 assay. (C) Detections of migration of LC cells treated with STAT3-OE by the wound healing assay and their quantitative analyses. (D) Detections of invasion of LC cells treated with STAT3-OE using transwell plates and their quantitative analyses. (E) Expressions of cadherins, vimentin, and JAK/STAT3 axis signaling proteins by western blot analyses and their quantitative analyses. Compared with the control group, *p < 0.05, **p < 0.01. Compared with the STAT3-NC + AETW group, △ p < 0.05, △△ p < 0.01. a: control group; b: STAT3-NC + AETW; c: STAT3-OE + AETW.

