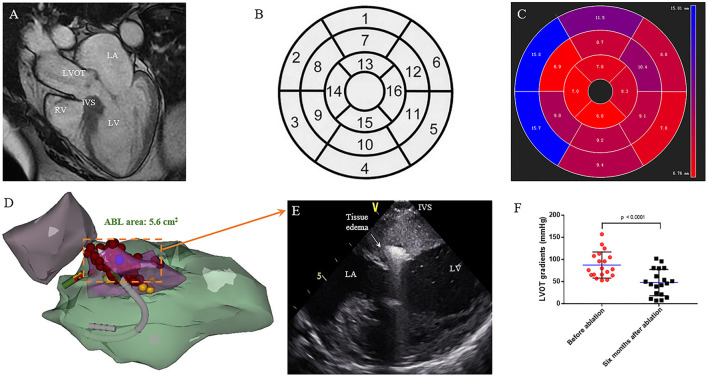
Figure 1.
Interventricular septal ablation in patients with HOCM. (A) CMR end-diastolic long-axis image demonstrates a significant hypertrophy in basal septum. (B) Display of the 16 myocardial segments on a circumferential polar plot. The recommended nomenclature for tomographic imaging of the heart: 1. Basal anterior, 2. Basal anteroseptal, 3. Basal inferoseptal, 4. Basal inferior, 5. Basal inferolateral, 6. Basal anterolateral, 7. Mid anterior, 8. Mid anteroseptal, 9. Mid inferoseptal, 10. Mid inferior, 11. Mid inferolateral, 12. Mid anterolateral, 13. Apical anterior, 14. Apical septal, 15. Apical inferior, 16. Apical lateral. (C) The circumferential polar plot presents a limited hypertrophy in basal anteroseptal and inferoseptal segments. The number indicates the average thickness of each segment. (D) Right anterior oblique (RAO) projection of the CARTO shell. Left ventricular (green), aorta (purple), SAM area of hypertrophic septum (pink), and left bundle branch (yellow) are presented. Ablation is performed on SAM area (red). (E) On the live ICE screen, significant tissue edema can be observed after ablation. (F) Reduction of obstruction at rest is seen on continuous-wave Doppler echocardiography. The LVOT gradient (in mmHg) is significantly decreased after 6 months follow up. (P = 0.001) LA, left atrium; LV, left ventricle; LVOT, left ventricular outflow tract; RV, right ventricle; IVS, interventricular septum.

