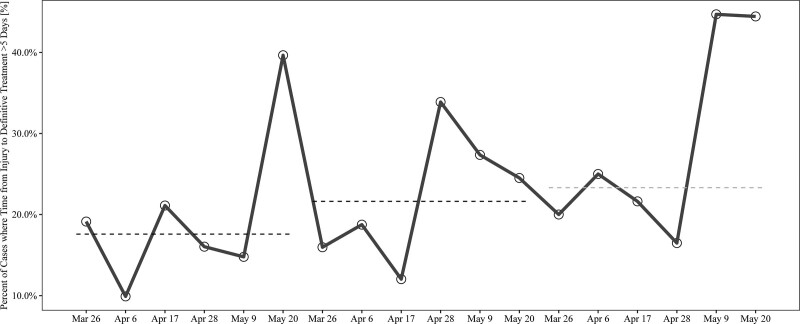
Fig. 1.
Percentage of fractures where time from injury to definitive treatment was >5 days. Data are summarized in 11-day intervals each year. The black lines represent median values across 2018 and 2019. The gray line represents median values across 2020. Five days was selected to define a delay as the 75th percentile for time to definitive treatment. *The final interval includes 12 days.

