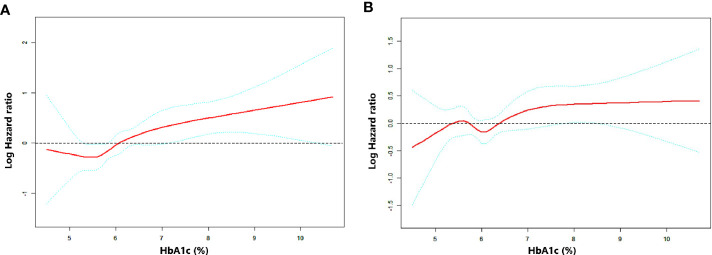
Figure 2.
Association between HbA1c level and OS as plotted through unadjusted and adjusted restricted cubic splines model. (A) model 1 (unadjusted), (B) model 2 (adjusted by stage, EGFR status, smoking history and first-line treatment). The middle red line indicates the point estimates of Log hazard ratios and the blue lines indicate the lower and upper limits of the corresponding 95% confidence intervals. The horizontal broken line is at hazard ratio=1 (logHR=0). A significant non-linear association was observed (A) P for non-linearity=0.0096, (B) P for non-linearity <0.001).

