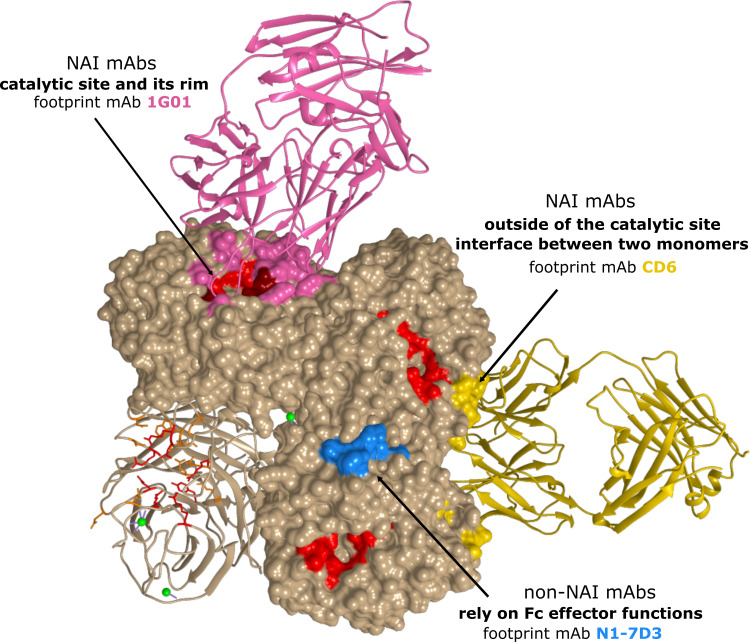
Figure 4.
Antigenic regions of N1 NA-specific mAbs. The A/California/04/2009 (H1N1) tetramer is depicted with one protomer in ribbon representation. The catalytic residues are depicted in red. For each region, a representative antibody footprint is shown: 1G01 (105) in pink (PDB 6Q23) with antibody contact residues in NA that overlap with the catalytic site in dark red; CD6 (103) in gold (PDB 4QNP) and N1-7D3 (113) in light blue.

