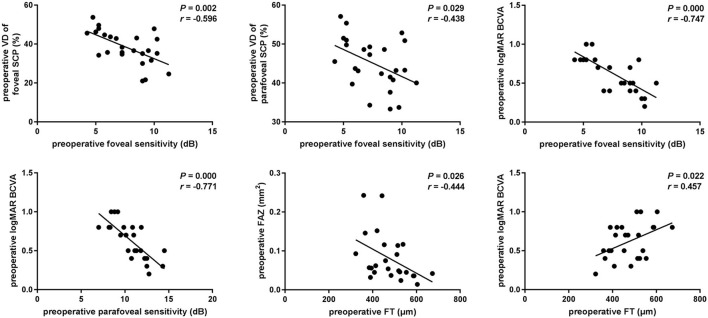
Figure 2.
Associations of visual function and OCTA parameters in iERM eyes at baseline. Scatterplots show the statistically significant correlation between preoperative foveal sensitivity and vessel density (VD) of foveal or parafoveal SCP (r = −0.596, P = 0.002; r = −0.438, P = 0.029). Preoperative BCVA was significantly correlated with foveal or parafoveal sensitivity, CFT (r = −0.747, P < 0.001; r = −0.771, P < 0.001; r = 0.457, P = 0.022). FAZ area was significantly correlated with CFT (r = −0.444, P = 0.026).

