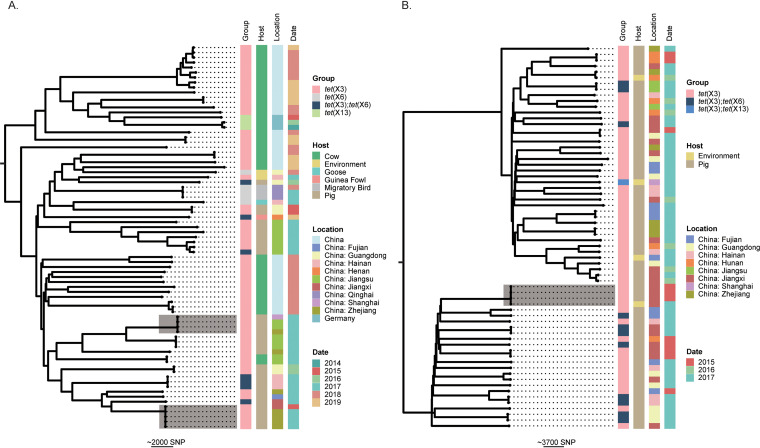
FIG 4.
Phylogenetic analysis of genomes carrying tet(X3)/tet(X6)/tet(X13) retrieved from GenBank. (A) The phylogenetic tree of A. indicus. (B) The phylogenetic tree of Acinetobacter sp002018365. The core-genome SNPs were used to calculate the phylogenetic trees. The trees are midpoint rooted. The tet(X) genes (Group), isolate source (Host), sampling location (Location), and years of isolation (Date) of strains are shown at the right side of each tree as indicated in the color keys. Two interregional transmission events for 4 and 5 strains of A. indicus and one cross-host event for 4 strains of Acinetobacter sp002018365 are highlighted by shading. The scale bar represents the number of SNPs.

