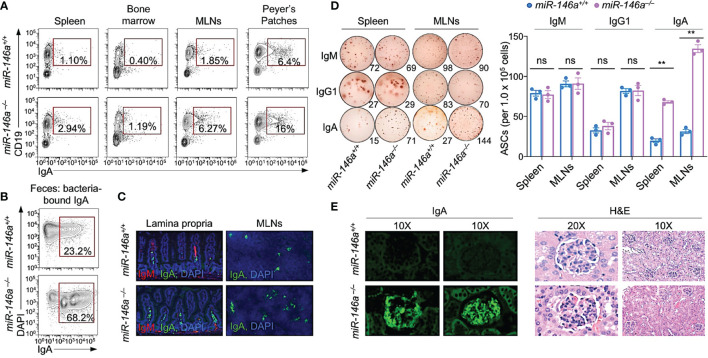
Figure 1.
miR-146a –/– mice (12 wk of age) displayed elevated systemic and gut IgA+ B cells, IgA-secreting cells, and kidney IgA deposition, as hallmark of IgA nephropathy. (A) IgA+ B cells in spleen, bone marrow, mesenteric lymph nodes (MLNs) and Peyer’s patches as analyzed by flow cytometry. (B) Fecal bacteria-bound IgA as analyzed by flow cytometry. (C) IgM+ and IgA+ B cells in the lamina propria and MLNs of miR-146a and miR-146a+/+ mice as visualized by fluorescence microscopy. (D) ELISPOT analysis of IgM-, IgG1- and IgA-secreting cells (ASCs) in spleen and MLNs. (E) Photomicrographs of kidney sections from miR-146a–/– and miR-146a+/+ mice, after fluorescence staining for mouse IgA (left) or hematoxylin and eosin (H&E) staining (right). Data are from one representative of three independent experiments yielding similar results; or mean ± SEM of 3-4 miR-146a–/– or miR-146a+/+ mice from three independent experiments (D, right panel). **p < 0.01, ns, not significant, unpaired t-test.

