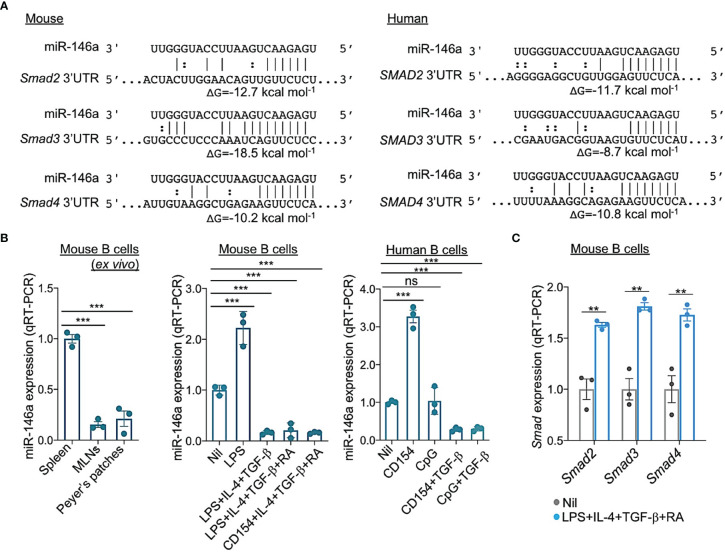
Figure 6.
miR-146a targets 3’UTR of Smad2, Smad3 and Smad4 mRNAs and is downregulated by the stimuli that induce CSR to IgA in human and mouse B cells. (A) Alignment of miR-146a with its target sites in the 3′ UTR of human and mouse SMAD2/Smad2, SMAD3/Smad3 and SMAD4/Smad4 mRNAs. The complementary base pairing between miRNA-146a and seed sequences within the 3’ UTRs of SMAD2/Smad2, SMAD3/Smad3 and SMAD4/Smad4, indicating miR-146a ability to silence SMAD2/Smad2, SMAD3/Smad3 and SMAD4/Smad4 transcripts. Gibbs free energy (ΔG) of nucleic acid folding and hybridization calculated by Mfold. Watson–Crick base-pairing (“|”); wobble base-pairing (“:”). (B) Expression of miRNA-146a in mouse spleen, MLN and Peyer’s patch B cells ex vivo; and in mouse spleen B cells stimulated for 72 h with Nil, LPS, LPS plus IL-4 and TGF-β, LPS or CD154 plus IL-4, TGF-β and RA, or human B cells stimulated for 72 h with Nil, CD154, CpG, and CD154 or CpG plus TGF-β, as analyzed by qRT-PCR. Values were normalized to expression of small nuclear/nucleolar RNAs Rnu6, Snord61, Snord68, and Snord70, and depicted as relative to the expression of miRNA-146a in spleen B cells stimulated with Nil, set as 1. (C) Expression of Smad2, Smad3 and Smad4 transcripts in mouse B cells stimulated for 72 h with Nil or LPS plus IL-4, TGF-β and RA, as analyzed by qRT-PCR and normalized to β-Actin, and depicted as relative to the expression of these genes in spleen B cells stimulated with nil, set as 1. Data are mean ± SEM from three independent experiments. ***p < 0.001, **p < 0.01, ns, not significant, unpaired t-test.

