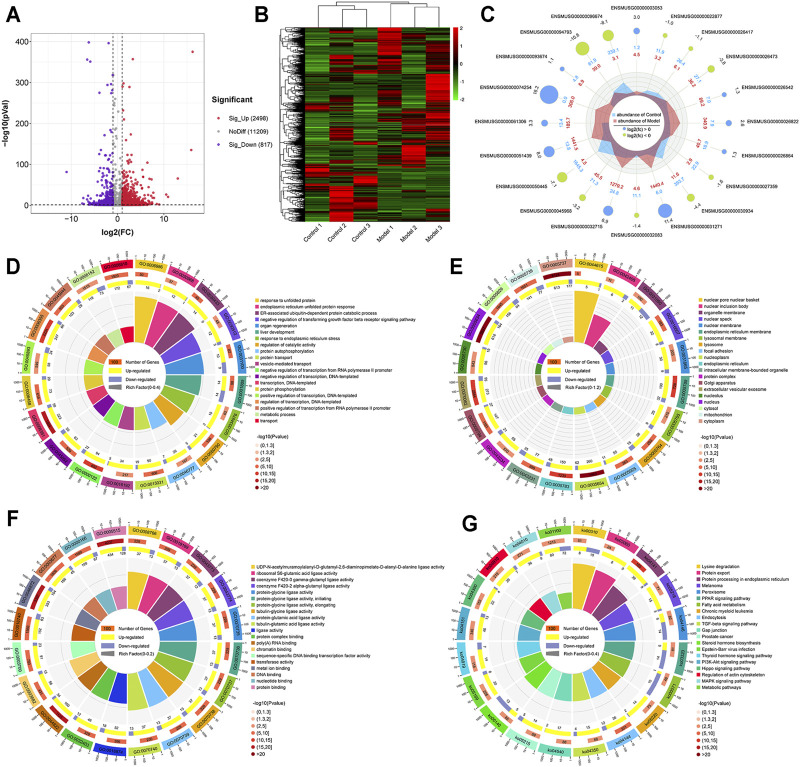
FIGURE 4.
Genes with differential m6A methylation modification in LF. (A) Volcano plot representation of microarray data on the differentially expressed m6A methylation genes. The blue and red dots to the left and to the right of the two vertical lines indicate more than a 2-fold change and represent the differentially expressed m6A methylation genes with statistical significance. (B) Hierarchical cluster analysis of differentially expressed m6A methylation genes. Hierarchical clustering shows that the differentially expressed m6A methylation genes ultimately cluster into two major branches, including hypermethylated genes, which are labeled in red, and hypomethylated genes, which are labeled in green. The darker the color, the more significant the difference. (C) The radar map shows the top 10 most significant hypermethylated genes and top 10 hypomethylated genes. (D) GO biological processes enrichment analysis. (E) GO cellular component enrichment analysis. (F) GO molecular function enrichment analysis. (G) KEGG enrichment analysis.

