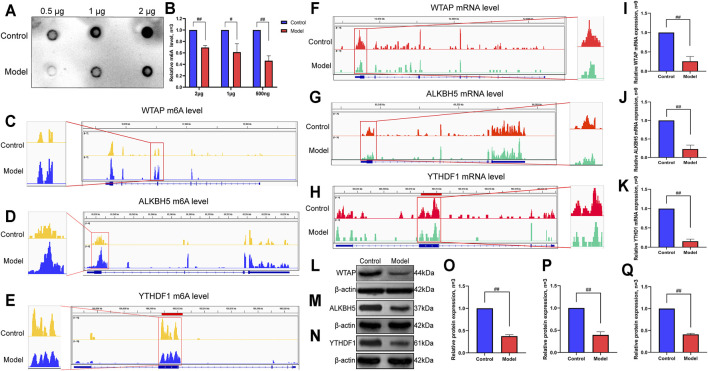
FIGURE 7.
Verification of m6A methylation level and methylase expression in LF. (A) The m6A methylation level in LF. (B) Semiquantitative analysis of m6A methylation. (C) IGV plots of the WTAP m6A level. (D) IGV plots of the ALKBH5 m6A level. (E) IGV plots of the YTHDF1 m6A level. (F) IGV plots of the WTAP expression level. (G) IGV plots of the ALKBH5 expression level. (H) IGV plots of the YTHDF1 expression level. (I) mRNA expression level of WTAP. (J) mRNA expression level of ALKBH5. (K) mRNA expression level of YTHDF1. (L) Protein expression levels of WTAP. (M) Protein expression levels of ALKBH5. (N) Protein expression levels of YTHDF1. (O) Semiquantitative analysis of WTAP protein. (P) Semiquantitative analysis of YTHDF1 protein. (Q) Semiquantitative analysis of ALKBH5 protein. ## p < 0.01 compared with the control group, # p < 0.05 compared with the control group.

