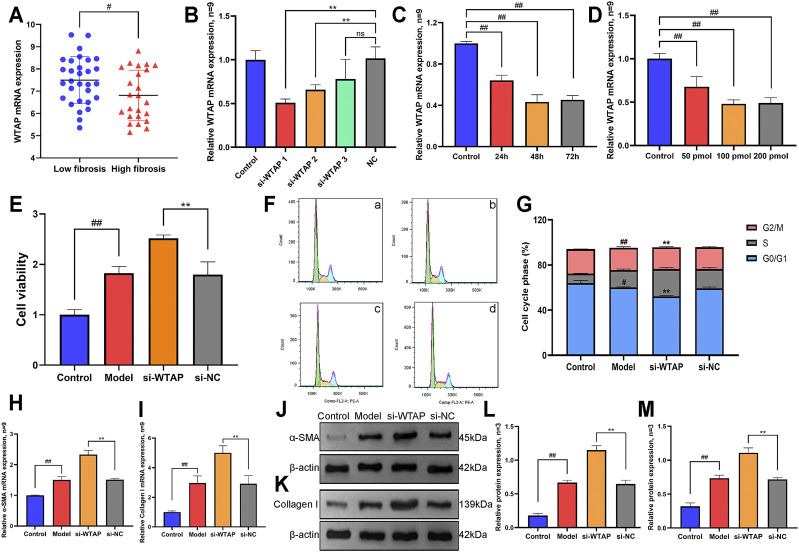
FIGURE 8.
Effects of methyltransferase WTAP on proliferation, cell cycle and activation markers of HSCs. (A) Expression levels of WTAP in low-fibrosis and high-fibrosis samples derived from the GEO database. (B) Small interfering RNA of WTAP was screened by RT-qPCR assay. (C) Optimal stimulation time of WTAP small interfering RNA was screened by RT-qPCR assay. (D) Optimal stimulation concentration of WTAP small interference RNA was screened by RT-qPCR assay. (E) Cell proliferation was detected by CCK8 assay. (F) The phase of the cell cycle was detected by flow cytometry. a, control group. b, model group. c, si-WTAP group. d, si-NC group. (G) Quantification of the cell cycle results. (H) mRNA expression level of α-SMA. (I) The mRNA expression level of collagen Ⅰ. (J) Protein expression levels of α-SMA. (K) Protein expression levels of collagen Ⅰ. (L) Semiquantitative analysis of α-SMA protein. (M) Semiquantitative analysis of collagen Ⅰ protein.

