. 2021 Oct 29;12(46):15423–15428. doi: 10.1039/d1sc03818d

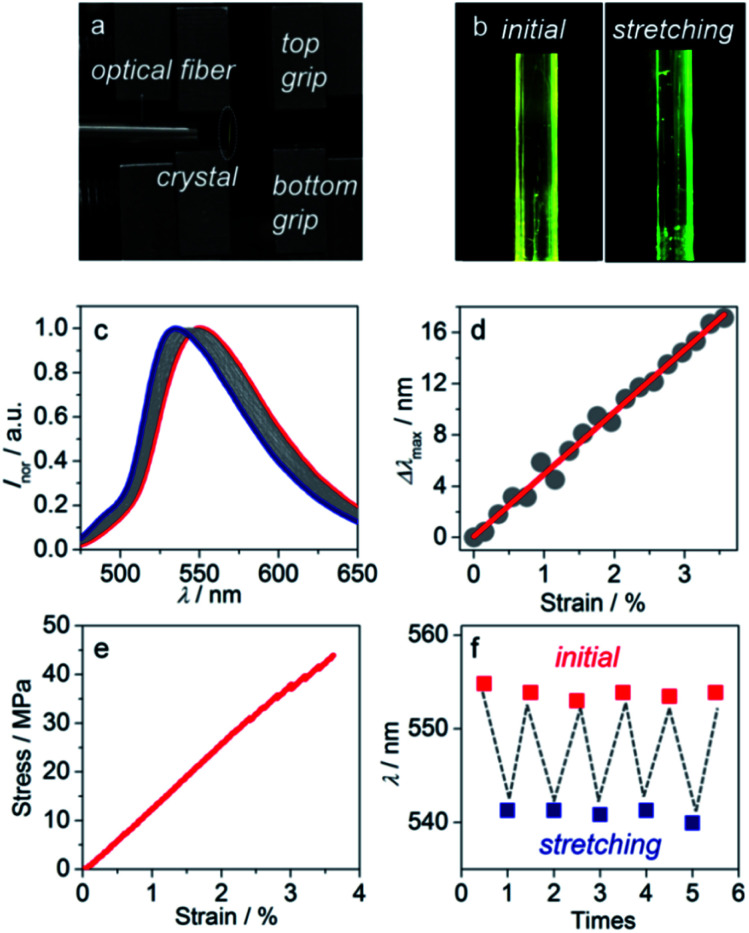
Fig. 3. (a) Photo of gathering stretching crystal emission spectra experimental facility. (b) The microscopic image of the initial fluorescence of the crystal and fluorescence of the crystal after stretching with a blue shift of 10 nm. (c) Normalized continuous fluorescence spectra of crystal during stretching. (d) The linear correlation between change of crystal maximal emission wavelength and stretching strain, the data in (d) was fitted by a function of y = a + bx, where a and b are 0.08 and 485.85, respectively. (e) Stress–strain curve of the stretching to 3.56% strain process. (f) Maximal emission wavelength of the same crystal measured at initial and stretching states alternately.

Fig. 3