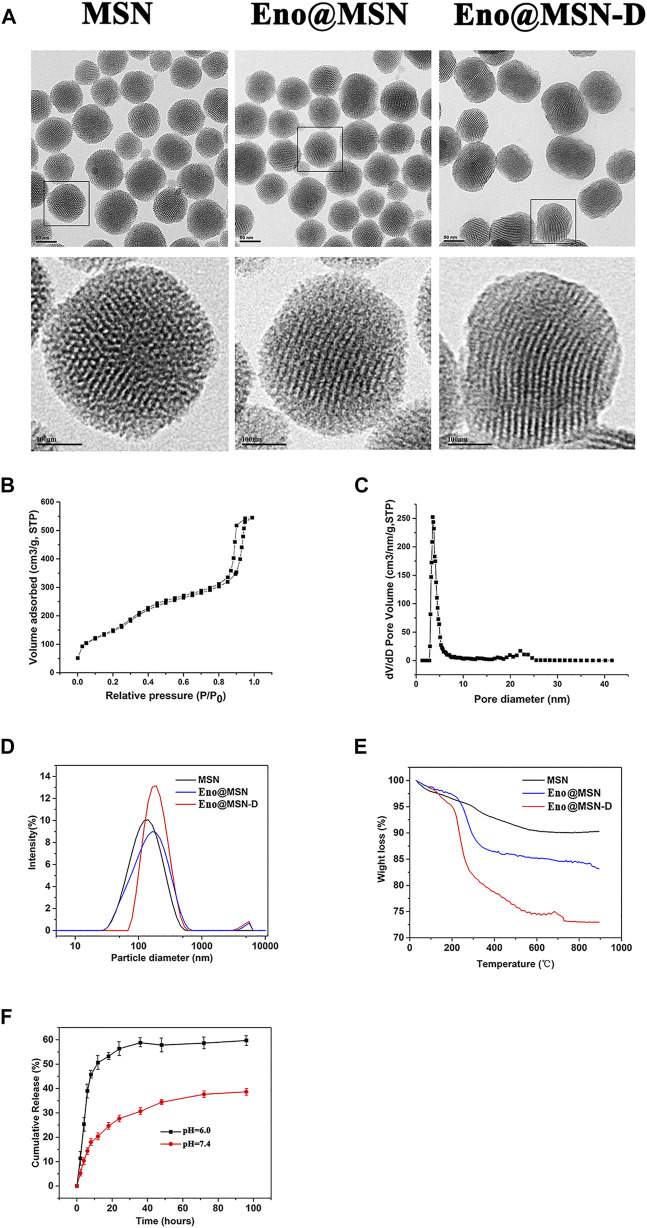
FIGURE 2.
(A) Typical TEM images of MSN, Eno@MSN, and Eno@MSN-D.(B). N2 adsorption−desorption isotherms curves of the MSN. (C) Pore size distribution curves of the MSN. (D) The dynamic light scattering (DLS) curves of MSN, Eno@MSN, and Eno@MSN-D. (E) TGA curves recorded for MSN, Eno@MSN, and Eno@MSN-D. (F) Accumulative release curve of Eno@MSN-D in different pH PBS (pH = 7.4, 6.0).

