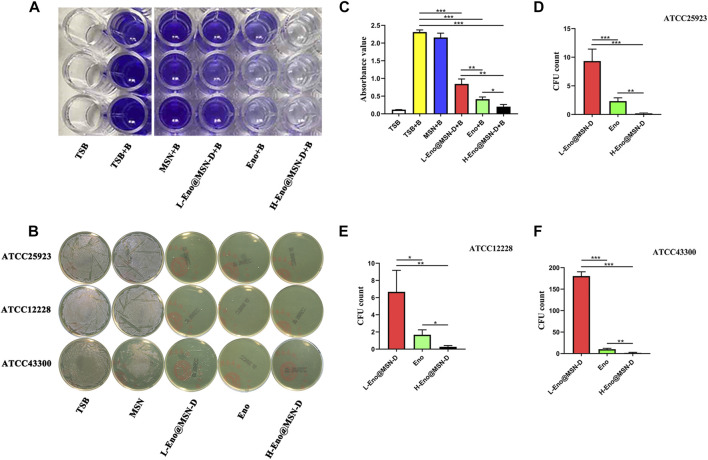
FIGURE 3.
(A–C) TSB (10 μg/ml), MSN (10 μg/ml), Eno (10 μg/ml), L-Eno@MSN (5 μg/ml), and H-Eno@MSN-D (10 μg/ml) were co-cultured with bacteria to form a biofilm, and then the absorbance was measured by crystal violet staining. (B) Determination of antimicrobial properties bacterial using the colony counting plate method. (D) The number of CFU after co-culture of ATCC25923 with Eno@MSN-D. (E) The number of CFU after co-culture of ATCC12228 with Eno@MSN-D. (F) The number of CFU after co-culture of ATCC43300 with Eno@MSN-D.

