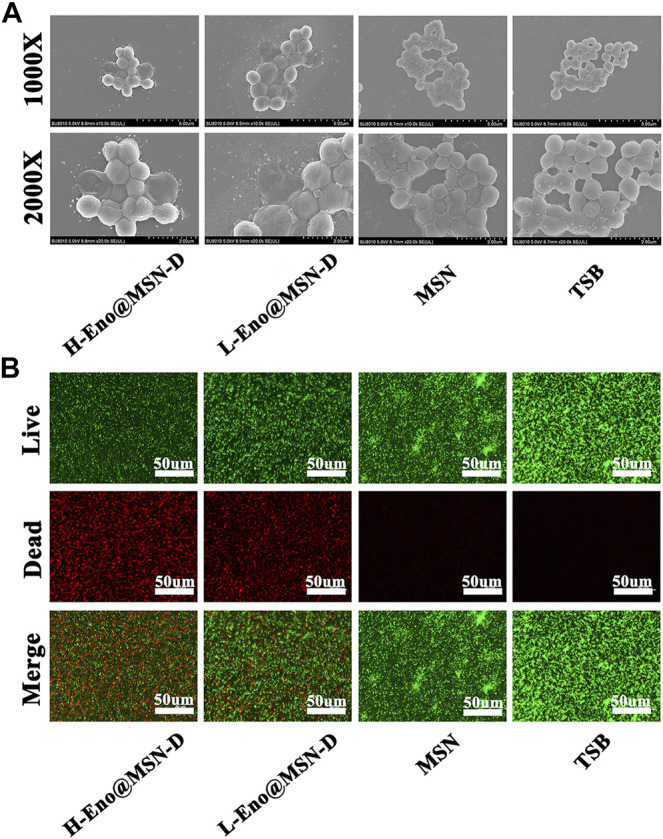
FIGURE 4.

(A) SEM images of TSB (10 μg/ml), MSN (10 μg/ml), Eno (10 μg/ml), L-Eno@MSN (5 μg/ml), H-Eno@MSN-D (10 μg/ml), and bacteria co-cultured on cover slides. (B) The fluorescence inverted microscope images of TSB (10 μg/ml), MSN (10 μg/ml), Eno (10 μg/ml), L-Eno@MSN (5 μg/ml), H-Eno@MSN-D (10 μg/ml), and bacteria co-cultured on confocal Petri dishes.
