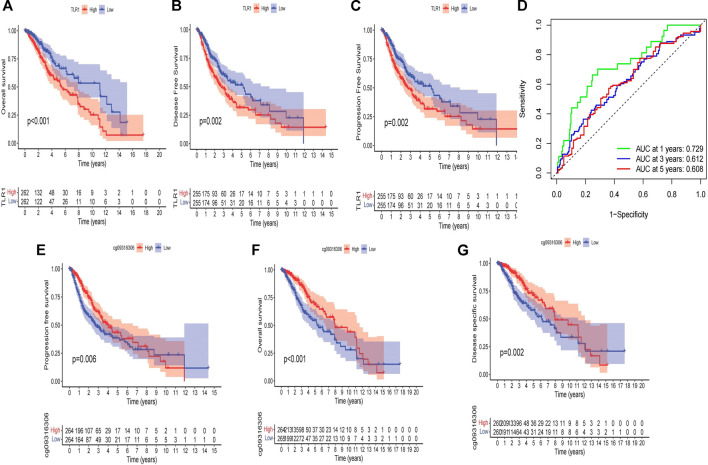
FIGURE 4.
Kaplan-Meier curves. (A) over survival in all patients, grouped by low and high TLR1 expression. (B) disease-free survival in all patients, grouped by low and high TLR1 expression. (C) progression free survival in all patients, grouped by low and high TLR1 expression. (D) AUC values for predicting LGG survival rates at 1, 3, and 5 years. (E) progression free survival in all patients, grouped by low and high methylation level of cg09316306 site. (F) over survival in all patients, grouped by low and high methylation level of cg09316306 site. (G) disease-specific survival in all patients, grouped by low and high methylation level of cg09316306 site.

