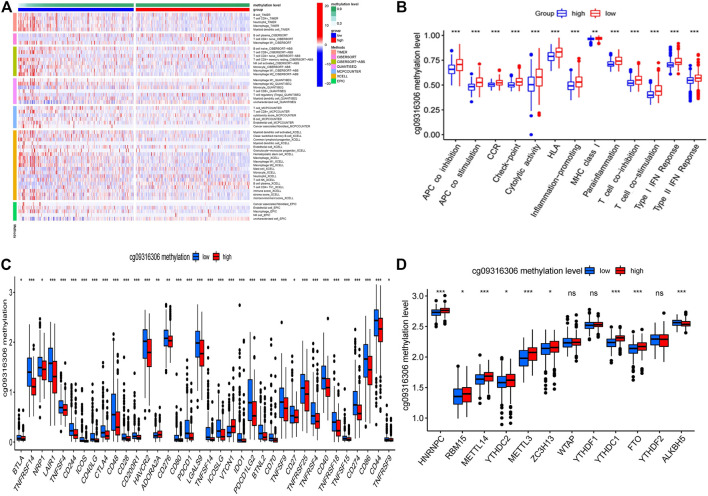
FIGURE 7.
The Correlation of TLR1 methylation site cg09316306 and immune cell infiltration. (A) the heatmap of immune responses based on different algorithms. (B) ssGSEA for the association between immune cell subpopulations and related functions. (C) immune checkpoints expression among the high and low groups. cg09316306 site methylation risk groups. (D) The expression of m6A-related genes between high and low cg09316306 site methylation risk group.

