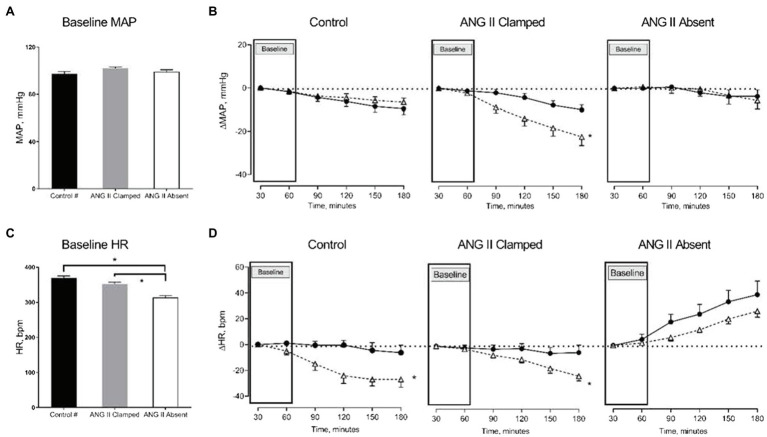
Figure 1.
Changes in mean arterial pressure (MAP) and heart rate (HR) in response to increased renal venous pressure (RVP). The bar graphs show the baseline MAP (A) and HR (C) in untreated control (black, control, n=8), angiotensin II (ANG II) Clamp (grey, ANG II Clamp, n=10) and ANG II Absent (open bar, ANG II Absent, n=8, BP supported by AVP) rats. The line charts represent changes from baseline, △MAP (B), and △HR (D). In the line chart, the first two time points in each line represent baseline. The latter four time points show control (●, control) and major RVP elevation (△, RVP20). Baseline MAP did not differ among groups (A). Increased RVP caused a significant decrease in MAP in the ANG II Clamp group (B; *p<0.05) but not in untreated control group or ANG II Absent group. Baseline HR was significantly lower in the ANG II Absent group than in untreated control and ANG II Clamp groups (C; *p<0.05). Increased RVP induced HR reduction in untreated control group and ANG II Clamp group (*p<0.05) but not in the ANG II Absent group (D). #Data from these were published in Huang et al. (2018).

