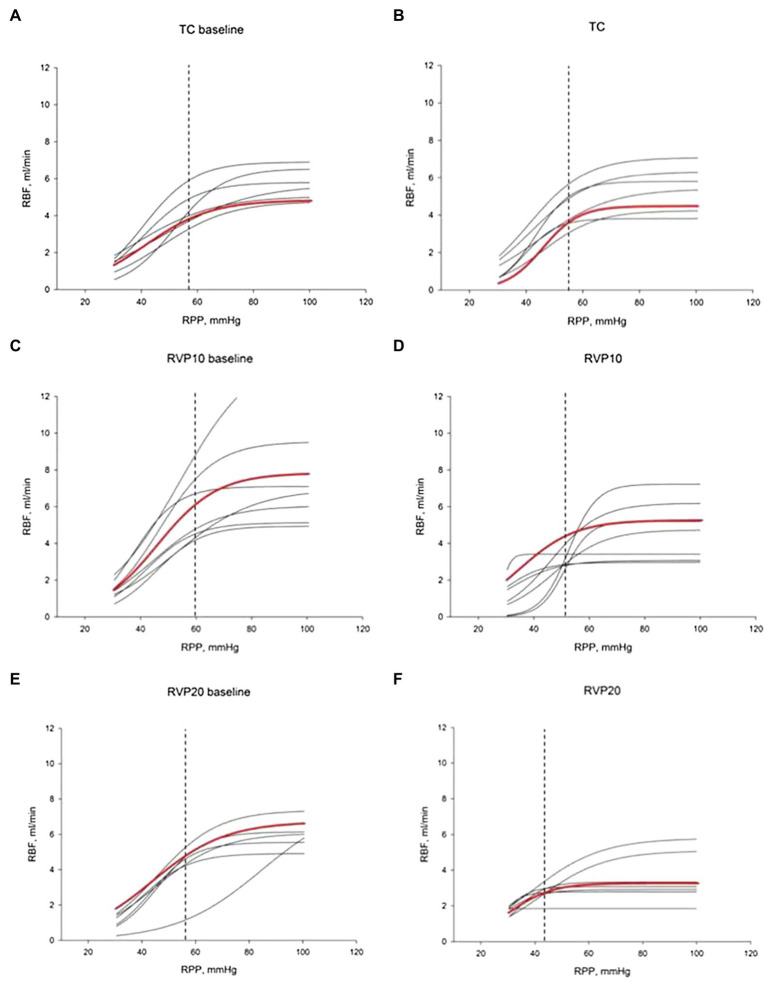
Figure 4.
Renal blood flow autoregulation curves. Each curve is generated by nonlinear regression analysis. (A,C,E) show baseline autoregulation curves before RVP manipulation. (B,D,F) show autoregulation curves without RVP elevation (B, TC, n=6), with RVP elevation of ~10mmHg (D, RVP 10, n=8) and with RVP elevation of ~20mmHg (F, RVP 20, n=8). The red curve indicates the average of the curves. The lower limit of RBF autoregulation is indicated by the vertical dashed line.

