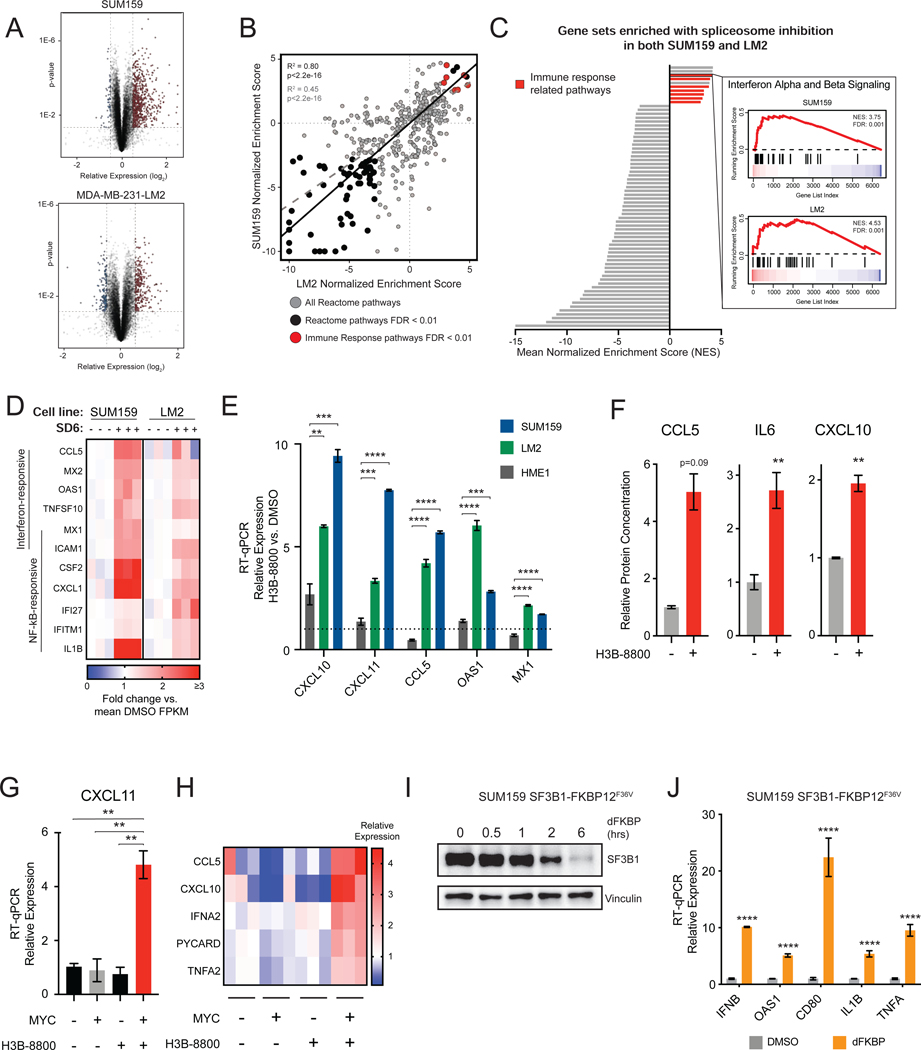
Figure 1. Spliceosome-Targeted Therapies Stimulate Antiviral Signaling in MYC-Driven Triple-Negative Breast Cancer.
(A) Volcano plot of RNA-seq gene expression changes due to spliceosome inhibition for two MYC-driven TNBC cell lines, SUM159 and LM2, treated with SD6 or DMSO (n=3 biological replicates).
(B, C) Spliceosome inhibition leads to activation of immune signatures in MYC+ TNBC cells. (B) Scatterplot of gene sets enriched in SUM159 and LM2 after SD6 treatment. Gene sets with FDR <0.01 in both cell lines are black. Immune-related gene sets are red. Pearson correlation between all pathways shown as dashed gray line (R2 =0.45, p<2.2e-16); between pathways with FDR<0.01 as black line (R2=0.80, p<2.2e-16). (C) Immune-related transcriptional pathways are among the most positively enriched. Gene sets with FDR <0.01 in both cell lines are shown, with immune-related gene sets in red (7 of 10 positively enriched pathways). The GSEA trace of Interferon Alpha and Beta Signaling is shown as an example.
(D) Spliceosome inhibition with SD6 leads to activation of interferon stimulated and NF-kB responsive genes. Heatmap of RNA-seq data shows relative expression (mean FPKM fold change vs. DMSO) of leading edge genes from enriched immune-related transcriptional pathways in panel (C).
(E) Spliceosome inhibition activates antiviral signaling in TNBC cells but not in non-transformed MECs. SUM159 and LM2 and non-transformed MECs (HME1) were treated with the same dose of H3B-8800. Gene expression assayed by RT-qPCR.
(F) Spliceosome inhibition leads to production of cytokines and chemokines. Conditioned media from SUM159 cells ± H3B-8800 was measured for CCL5, IL6, and CXCL10 (mean ± SEM, n=2 technical replicates, two-tailed unpaired Student’s t-test).
(G, H) MYC hyperactivation primes antiviral transcriptional changes in response to spliceosome inhibition. HMECs with inducible MYC were treated ± 4-OHT (to induce MYC) ± H3B-8800. Transcription of (G) CXCL11 and (H) other antiviral signaling targets was assayed by RT-qPCR.
(I, J) Chemical genetic degradation of SF3B1 upregulates interferon-stimulated and NF-kB responsive genes. SUM159s engineered with endogenous SF3B1 knockout and exogenous SF3B1-FKBP12F36V cDNA expression were (I) treated with dFKBP ligand to deplete SF3B1. (J) Gene expression assayed by RT-qPCR.
Bar plots of RT-qPCR data in (E), (G), and (J) are expressed relative to DMSO (mean ± SEM, n=3 biological replicates, two-tailed unpaired Student’s t-test).
**p<0.01, ***p<0.001, **** p<0.0001. See also Figure S1.

