Figure 2. Components of Antiviral Response Pathways Modulate Sensitivity to Spliceosome Inhibition.
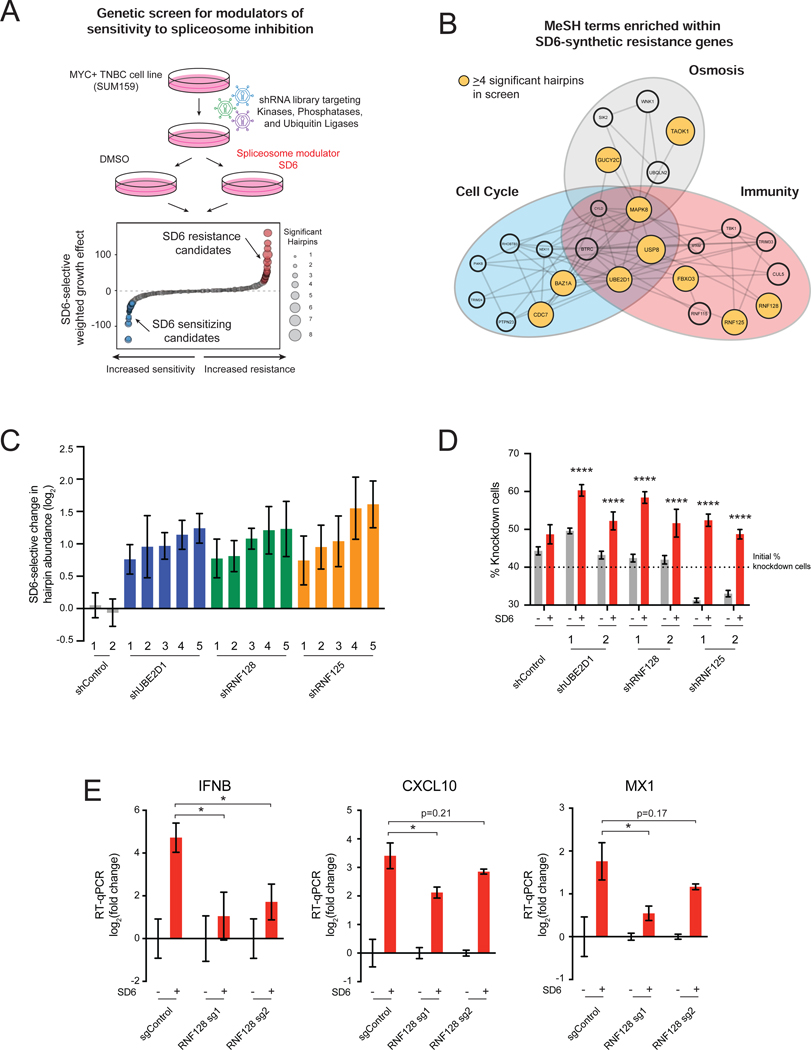
(A, B) Immunity-related genes confer resistance to spliceosome inhibition. (A) shRNA screen for genes that modulate sensitivity to spliceosome-targeted therapies. SUM159 cells were transduced with an shRNA library and cultured ± SD6. Waterfall plot shows combined SD6-selective growth effect of each gene, calculated as a weighted effect of knockdown by multiple shRNAs. SD6 resistance candidates are red. SD6 sensitizing candidates are blue. (B) MeSH term enrichment analysis of top 50 resistance candidates. Enriched MeSH terms (FDR<0.1) grouped by related function. Node size represents number of shRNAs that significantly conferred resistance (≥4 significant shRNAs highlighted in yellow).
(C, D) Knockdown of UBE2D1, RNF128, and RNF125 confers resistance to spliceosome inhibition. (C) For each gene, the top five independent shRNAs from the screen are plotted along with two negative control shRNAs. log2 (fold change) calculated based on change in shRNA abundance in SD6 vs. DMSO (mean ± SEM, n=4 biological replicates). shRNAs with log2 (fold change) > 0.5 and p-value ≤ 0.05 shown. (D) SUM159 cells transduced with RNF128, RNF125, or UBE2D1-targeting or control shRNAs were mixed (40%) with SUM159-E2 Crimson cells (60%) and cultured ± SD6. Shown is the percentage of cells expressing a given shRNA for DMSO and SD6 treated samples (mean ± SEM, n=6 biological replicates, two-tailed unpaired Student’s t-test).
(E) RNF128 is required for SD6-induced antiviral signaling. SUM159 cells expressing two RNA128-targeting or negative control sgRNAs were tested for expression of IFNB, CXCL10, and MX1 ± SD6 treatment. Data shown as expression relative to DMSO (mean ± SEM, n=3 biological replicates, two-tailed unpaired Student’s t-test).
*p<0.05, ****p<0.0001. See also Figure S2 and Tables S1 and S2.

