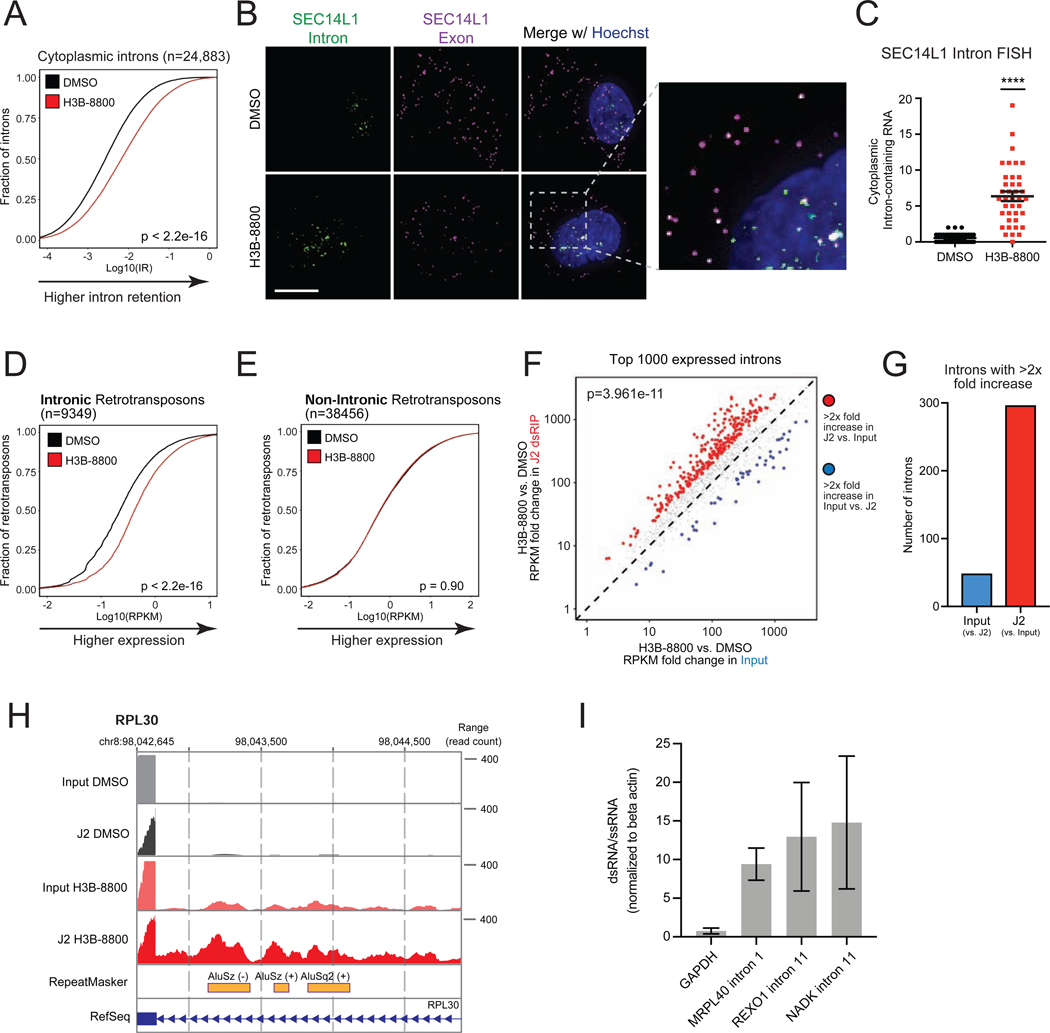
Figure 4. Intron-Retained RNAs Accumulate in the Cytoplasm and Form dsRNA in Response to Spliceosome-Targeted Therapies.
(A-C) Spliceosome inhibition leads to cytoplasmic intron retention in TNBC cells. (A) RNA-seq was performed on cytoplasmic RNA from SUM159 ± H3B-8800 and intron retention (IR) was assessed. Empirical cumulative distribution curves of mean IR scores (n=2 biological replicates) shown. A rightward shift in the red curve indicates increased IR (p<2.2e-16, Mann-Whitney U). (B) RNA fluorescence in situ hybridization (FISH) images of retained introns and surrounding exon sequences for SEC14L1 ± H3B-8800. Arrows indicate overlapped intron and exon foci. Scale bars, 10μm. (C) Quantification of cytoplasmic intron-retained mRNAs per cell (mean ± SEM from >35 cells per group, two-tailed unpaired Student’s t-test).
(D, E) Intron-residing retrotransposons increase in abundance in the cytoplasm of TNBC cells after H3B-8800. Empirical cumulative distribution curves of mean RPKMs are plotted for (D) 9,349 intron-residing retrotransposons or (E) 38,456 non-intronic retrotransposons detected in RNA-seq. A rightward shift in the red curve indicates increased expression in intronic retrotransposons (p<2.2e-16, Mann-Whitney U) but not non-intronic retrotransposons (p = 0.90, Mann-Whitney U).
(F, G, H) Retained introns induced by spliceosome inhibition form dsRNA. SUM159 cells ± H3B-8800 (n=2 biological replicates). dsRNA was enriched by J2 immunoprecipitation followed by poly(A) RNA-seq (J2 dsRIP-seq). (F) Scatterplot of intron expression fold changes ± H3B-8800 of the top 1000 introns ranked by expression (RPKM). (G) Number of retained introns with >2× increase in input or J2-dsRIP (compared to the other state). (H) Representative intron-embedded retrotransposons (RPL30 gene).
(I) Introns retained after H3B-8800 form dsRNA structures. Lysates from SUM159 cells ± H3B-8800 were treated ± RNaseONE, a ssRNA specific ribonuclease. Relative RNA levels were quantified via RT-qPCR (mean ± SEM, n=3 biological replicates). Data shown are relative to ACTB mRNA, a well-characterized ssRNA.
****p<0.0001. See also Figure S4.

