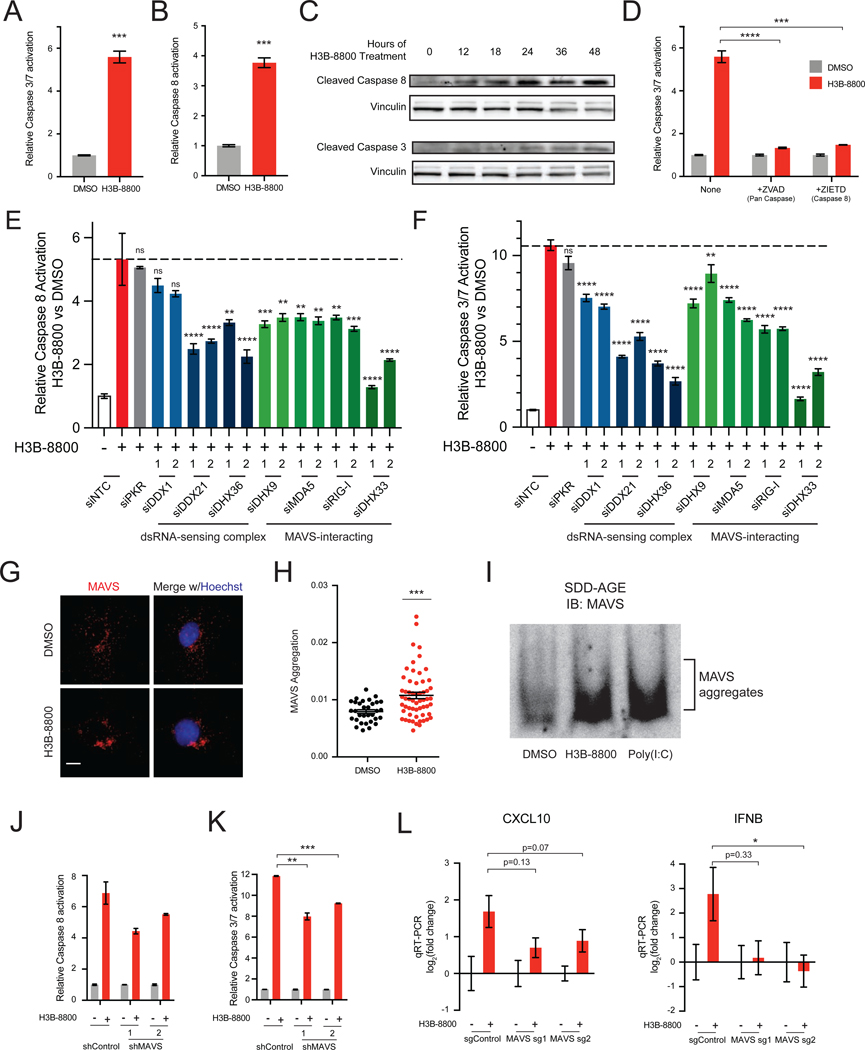
Figure 5. Spliceosome-Targeted Therapies Activate Extrinsic Apoptosis via Antiviral dsRNA Sensing Pathways.
(A-D) Spliceosome inhibition activates apoptosis via extrinsic mechanisms. (A) Caspases-3 and −7 activity from SUM159s ± H3B-8800. (B) Caspase-8 activity from SUM159s ± H3B-8800. (C) Immunoblotting time course shows cleavage of caspase-8 precedes cleavage of caspase-3 in response to spliceosome inhibition in SUM159 cells. (D) H3B-8800-induced apoptosis requires the extrinsic initiator caspase-8. SUM159s ± H3B-8800 and no caspase inhibitor, pan-caspase inhibitor (ZVAD), or caspase-8 inhibitor (ZIETD) were measured for caspases-3 and −7.
(E, F) Multiple dsRNA sensors contribute to activation of extrinsic apoptosis and downstream effector caspases upon spliceosome inhibition. SUM159 cells were transfected with control (NTC) siRNA or siRNA targeting the indicated genes, treated ± H3B-8800, and assessed for (E) caspase-8 and (F) caspases-3 and −7 (mean ± SEM, n≥3 biological replicates, one-way ANOVA with Dunnett’s multiple comparison test).
(G-I) Spliceosome inhibition causes aggregation of the mitochondrial antiviral signaling protein MAVS. (G) MAVS immunofluorescence (IF) of SUM159 cells ± H3B-8800. Scale bars, 10μm. (H) MAVS aggregation quantified by inverse dispersal of IF signal (mean ± SEM, two-tailed unpaired Student’s t-test). (I) P5 mitochondrial fraction was prepared from SUM159 cells ± H3B-8800 or transfected with poly (I:C). MAVS aggregation analyzed by SDD-AGE.
(J, K) Knockdown of MAVS suppresses activation of extrinsic apoptosis and downstream effector caspases upon spliceosome inhibition. SUM159 cells expressing control or MAVS-targeted shRNA were treated ± H3B-8800 and assessed for (J) caspase-8 and (K) caspases-3 and −7 (mean ± SEM, n=2 biological replicates, two-tailed unpaired Student’s t-test).
(L) MAVS knockout suppresses upregulation of antiviral signaling in TNBC cells treated with H3B-8800. SUM159 cells expressing two independent MAVS sgRNAs assessed for CXCL10 and IFNB expression ± H3B-8800. Data shown relative to DMSO (mean ± SEM, n=3 biological replicates, two-tailed unpaired Student’s t-test).
Bar plots in panels (A), (B), and (D) of caspase activity shown as mean ± SEM, n=3 biological replicates, two-tailed unpaired Student’s t-test.
*p<0.05, **p<0.01, ***p<0.001, ****p<0.0001. See also Figure S5.

