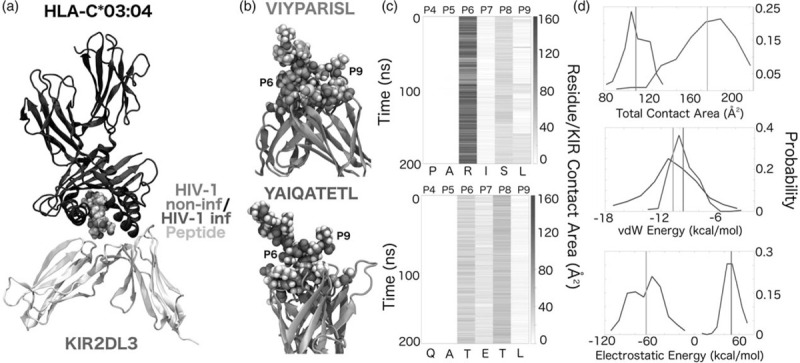
Fig. 5.
Molecular dynamics simulations of HLA-I/peptide-KIR complexes.

(a) Illustration of canonical HLA-C∗03:04-n3-KIR2DL3 arrangement. (b) Equilibrated peptide-KIR2DL3 for peptides n3 (green) and h9 (purple). (c) KIR-peptide contact area, as a function of time and peptide residue position. (d) Total peptide-KIR contact area, peptide-KIR vdW interaction energy, and peptide-KIR electrostatic energy. Mean values are indicated by vertical lines that are colour-coded according to the convention established in (b).
