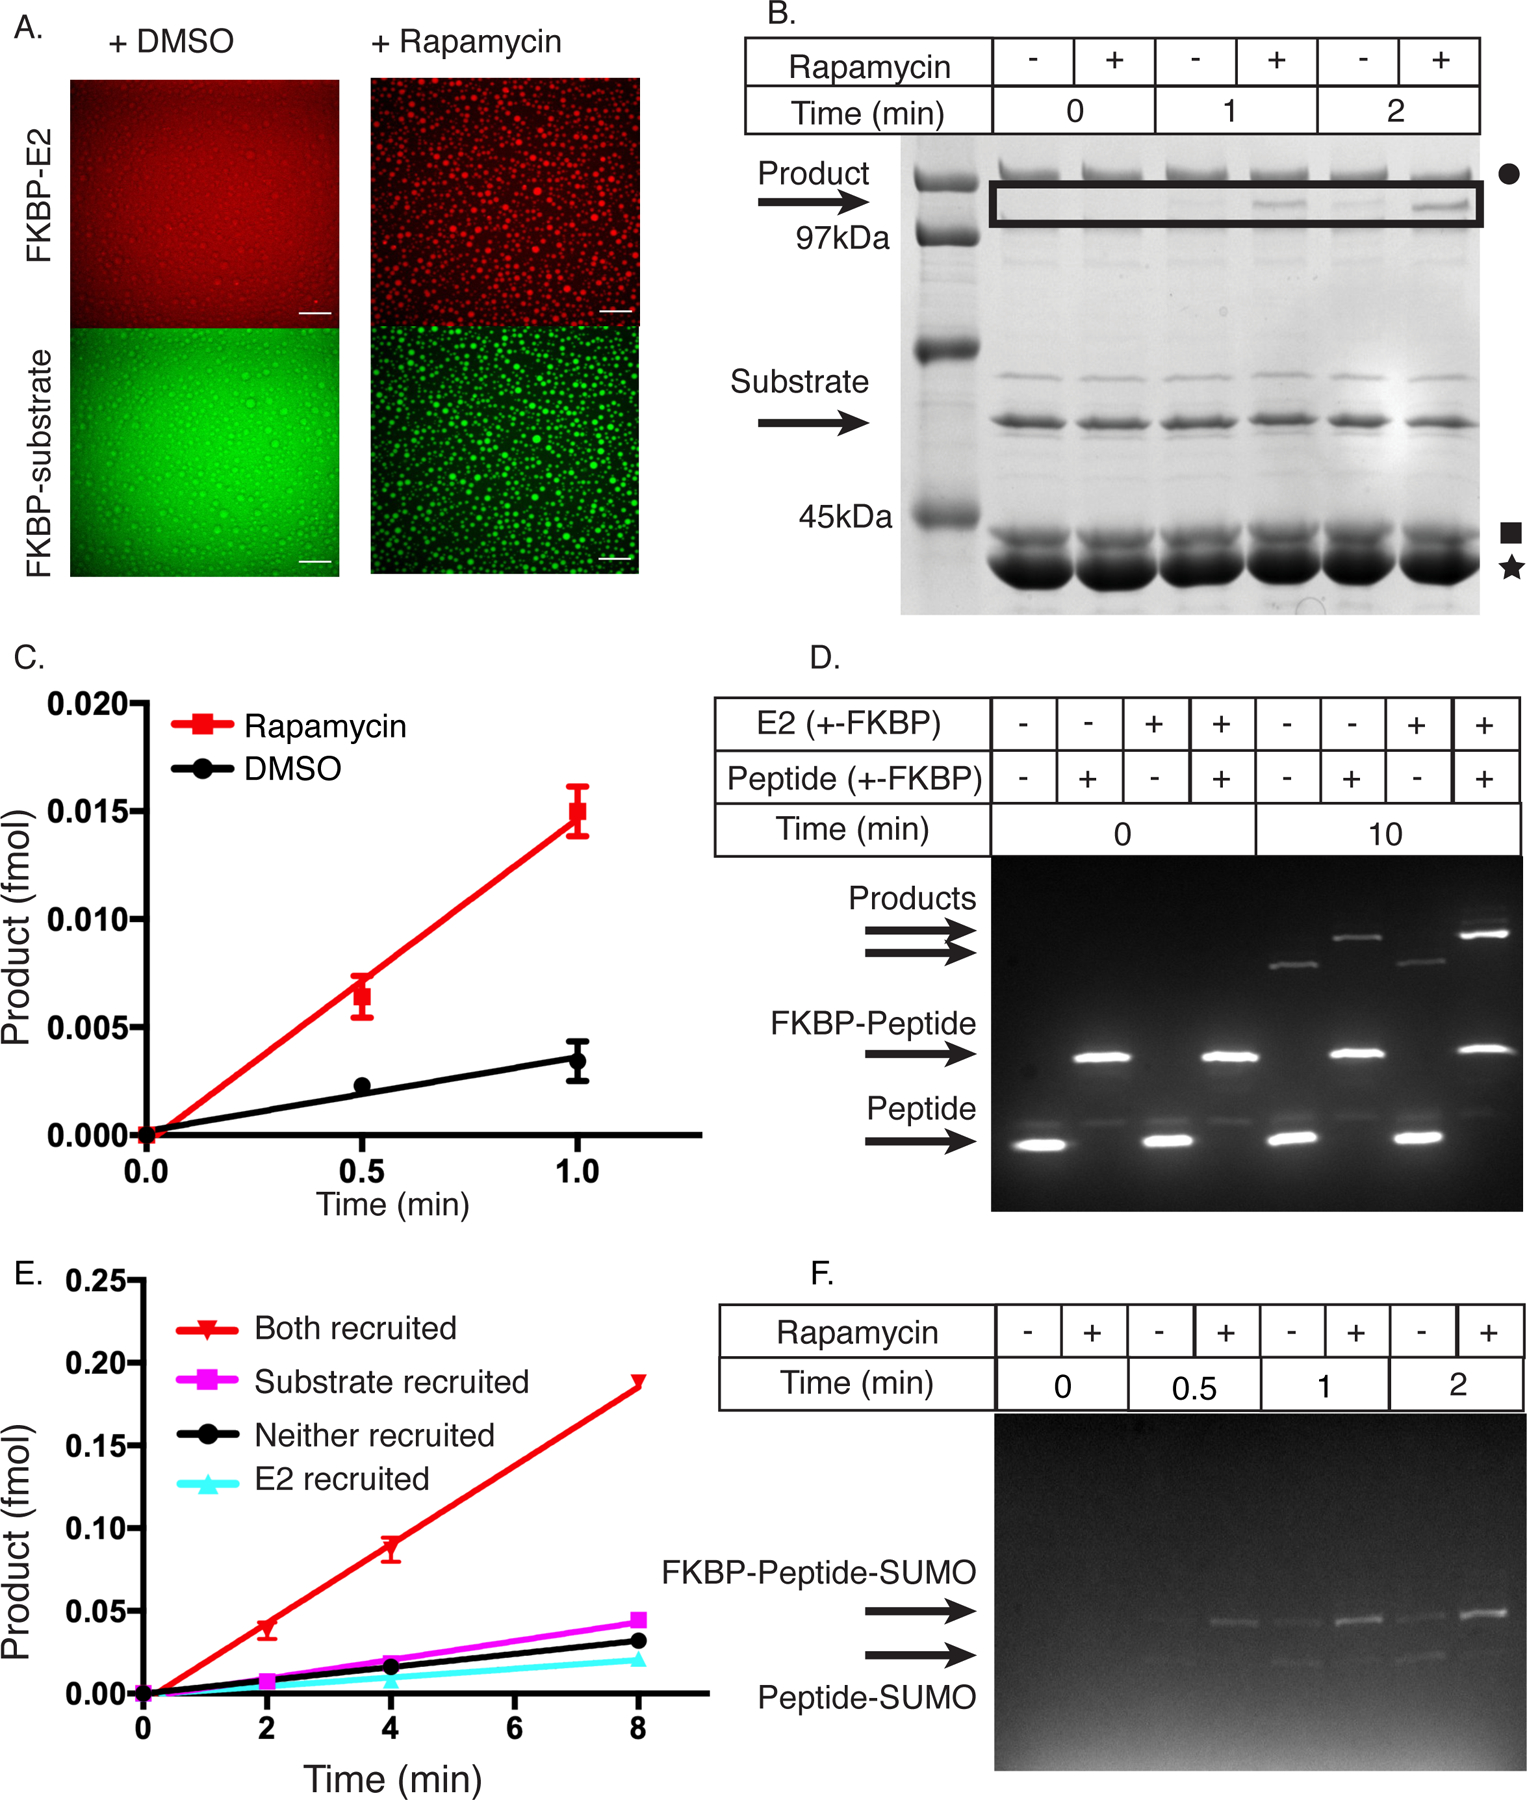
Figure 2. Condensates increase the total SUMOylation rate.

(A) Confocal fluorescence microscopy images of mCherry-FKBP-E2 (top row) and FKBP-EGFP-substrate (bottom row) in the presence of FRB-polySH33:polyPRM5 condensates upon addition of DMSO control (left column) or rapamycin (right column). These images are representative of 3 independent experiments. Scale bar is 50um.
(B) SDS-PAGE gel stained with Coomassie blue illustrating production of SUMOylated substrate as a function of time with either DMSO (−) or rapamycin (+). Black square denotes E2, black star denotes FRB-polySH33, and black circle denotes E1. This gel is representative of 3 independent experiments.
(C) Quantification of data in panel B, showing intensity of the SUMOylated substrate band as a function of time. DMSO = black circles, rapamycin = red squares. Data are plotted as the mean and SD from n=3 independent experiments.
(D) Fluorescence-detected SDS-PAGE gel depicting production of SUMOylated substrate as a function of time when E2, substrate, both or neither are fused to FKBP (and thus are recruited into FRB-polySH33-polyPRM5 droplets). + indicates FKBP-fusion, - indicates non-fused. This gel is representative of 4 independent experiments.
(E) Quantification of data in panel D, showing intensity of the SUMOylated substrate band as a function of time. E2+substrate recruited, inverted red triangles; E2 recruited, cyan triangles; substrate recruited, magenta squares; neither recruited black circles. Absolute amounts quantified by an internal standard. Data are plotted as the mean and SD from n=4 independent experiments.
(F) Fluorescent SDS page gel of SUMOylation of PML peptide or FKBP-PML peptide when co-incubated with FRB-polySH33:polyPRM5 condensates and either DMSO or rapamycin. SUMOylated FKBP-peptide is the upper band, and SUMOylated peptide is the lower band. This gel is representative of 2 independent experiments.
All figure panels have associated raw data.
