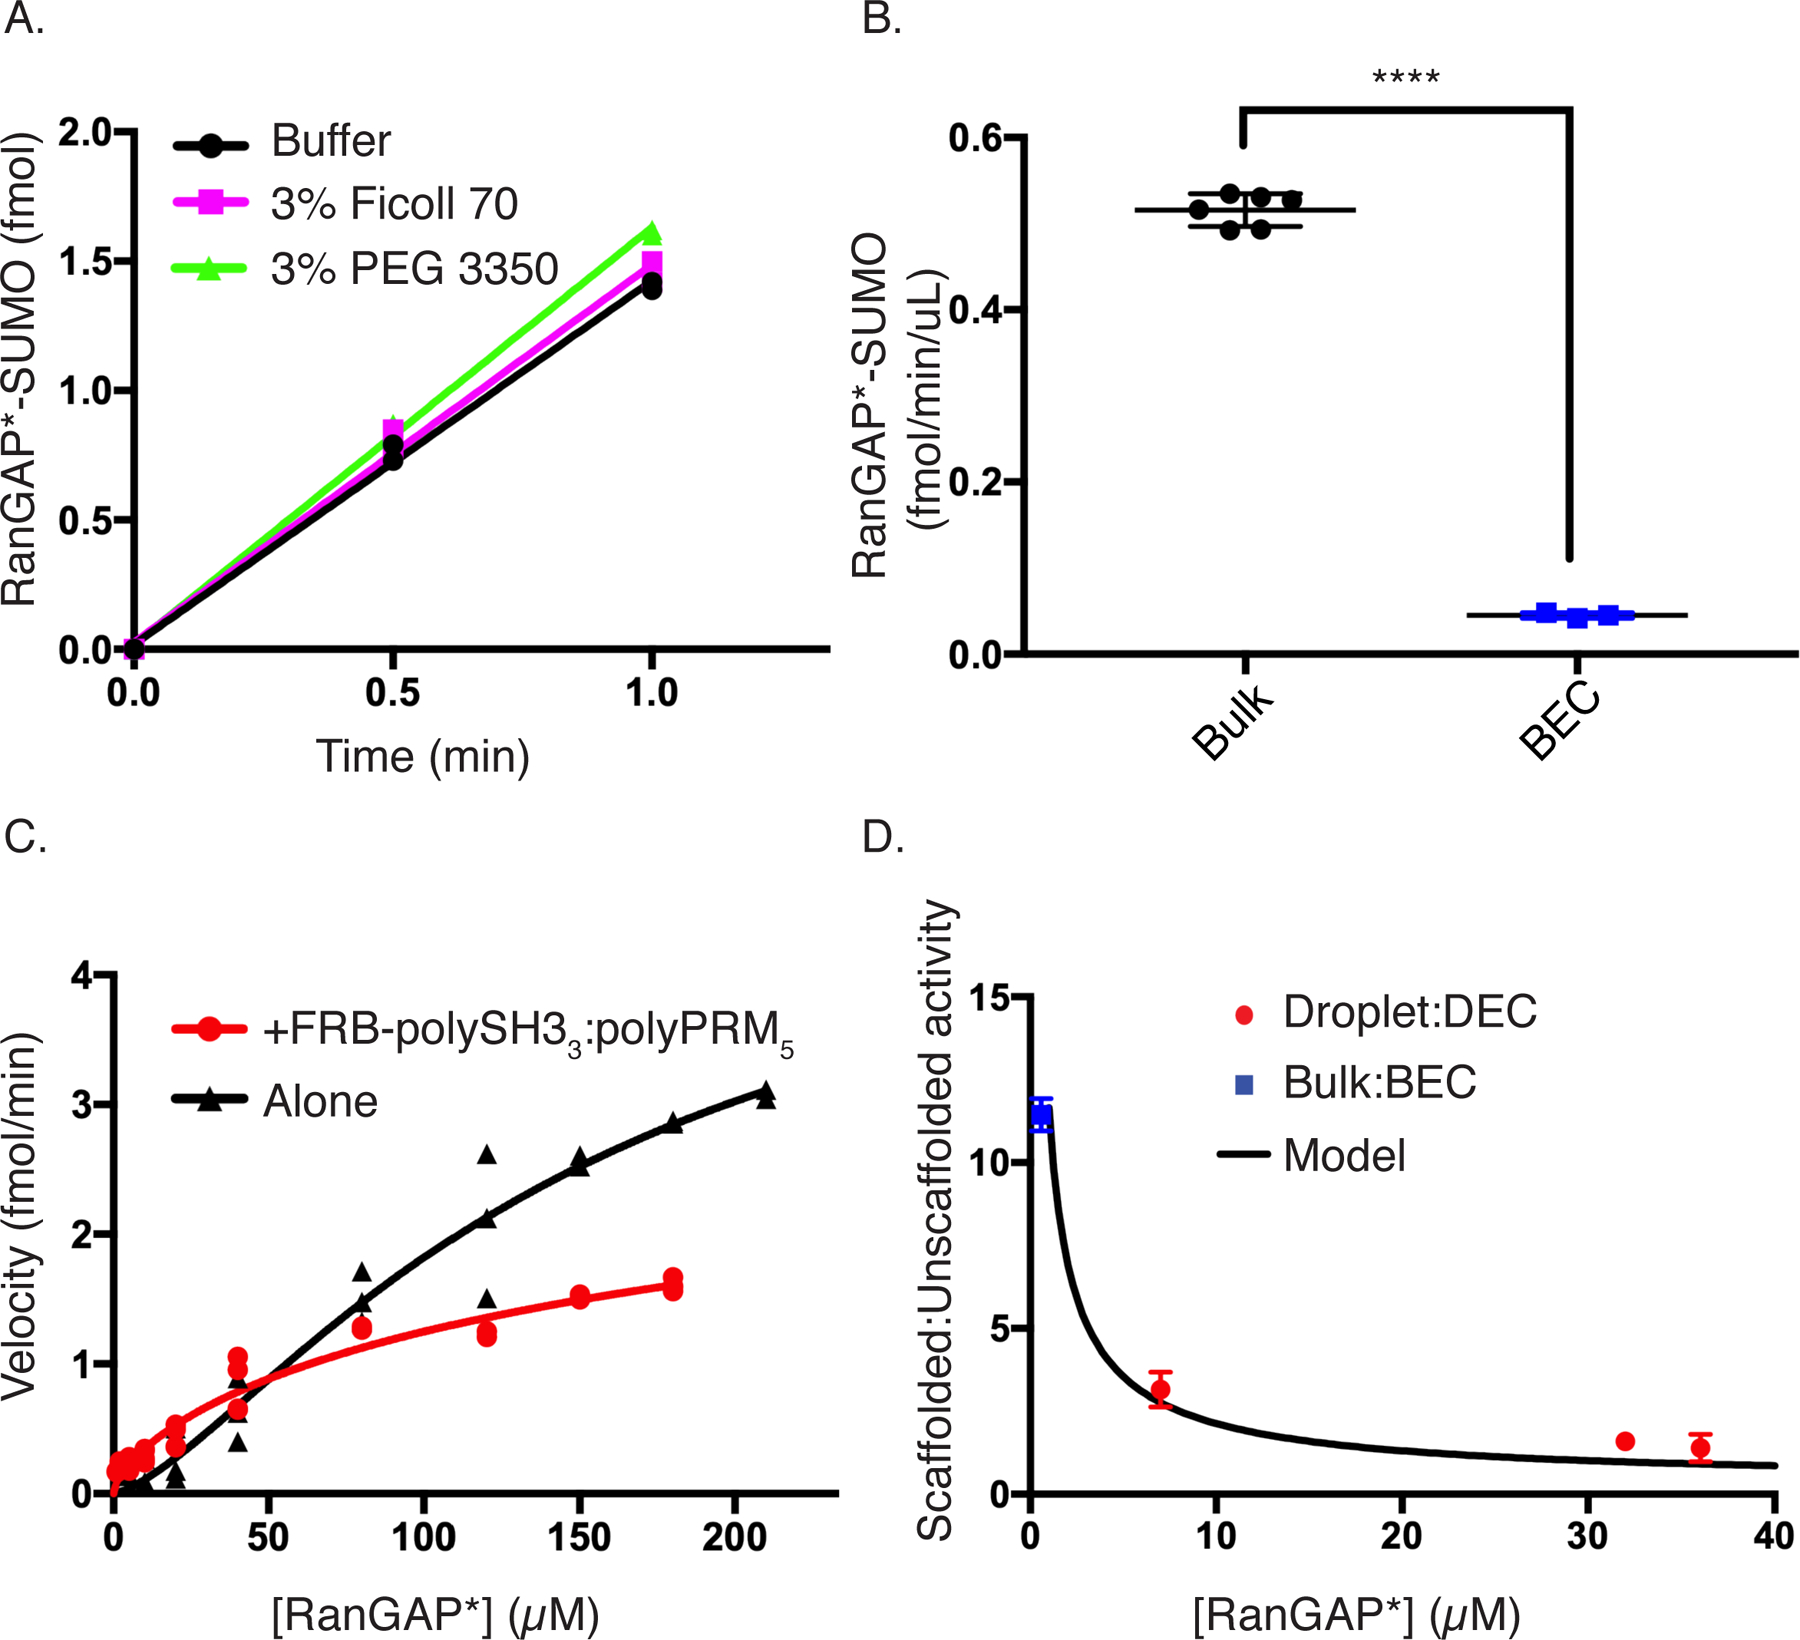
Figure 5. Excess activity is due to a scaffold-induced decrease in KM.

(A) Time course showing the production of SUMOylated substrate with E1, E2, RanGAP*, and SUMO1 at droplet equivalent concentrations (black circles), +3% Ficoll 70 (magenta squares), or + 3% PEG 3350 (green triangles). Each datapoint shown in duplicate.
(B) Bar chart showing the volume-normalized reaction rate of bulk (black) or bulk equivalent concentration (BEC, blue). Error bars represent the SEM from 6 experiments. Statistical significance was assessed by a two-tailed, unpaired Student’s t-test. **** represents a p-value < 0.0001 (1.3 × 10⁻⁹).
(C) Rate of production of SUMOylated RanGAP* as a function of substrate concentration with (red squares) or without (black circles; same data as shown in Supplementary Figure 3D) sub-threshold concentrations of FRB-polySH33-polyPRM5. Each symbol represents the mean and standard deviation from n=3 (<150uM) and n=2 (≥150uM) independent experiments. Points without errors bars have standard deviations too small to show.
(D) Ratio of scaffolded:unscaffolded reaction rate (black curve) calculated by dividing the fit of the red curve from the fit of the black curve in Panel C. Overlaid on this curve are the scaffolded:unscaffolded rate ratios from bulk vs BEC (blue square) and droplet vs DEC (red circles). Error bars represent SEM from a total of 6 independent measurements for the bulk:BEC point and the droplet:DEC datapoints at ~7 and 32uM. The 36uM datapoint is from 3 independent experiments.
All figure panels have associated raw data.
