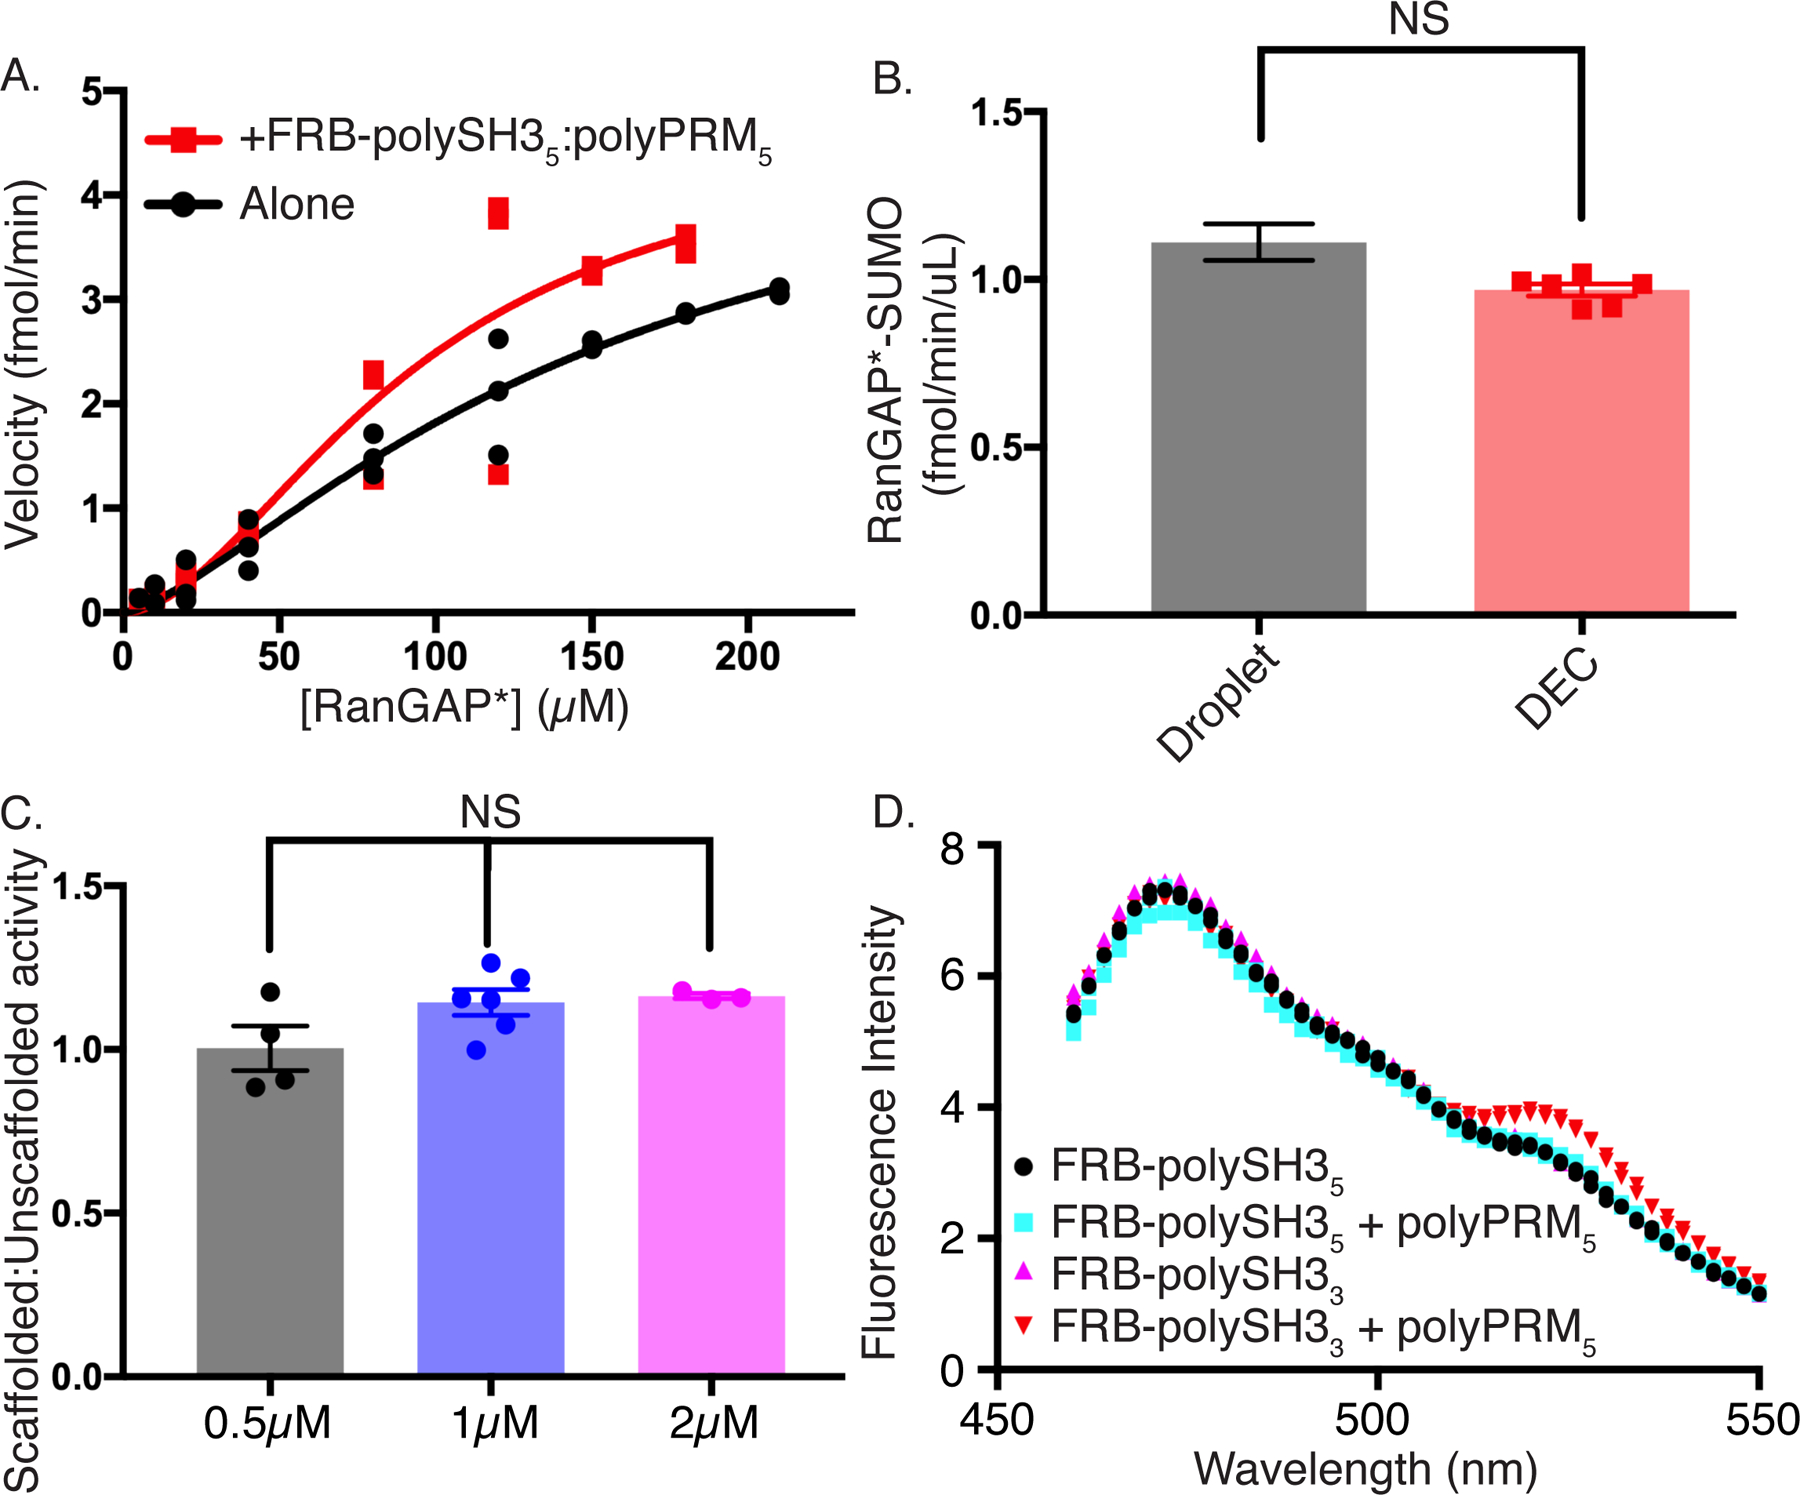
Figure 6. Activity enhancement is scaffold-specific.

(A) Rate of production of SUMOylated RanGAP* as a function of RanGAP* concentration with (red) or without (black; same data as shown in Supplementary Figure 3D) subcritical concentrations of FRB-polySH35-polyPRM5. Each symbol represents the mean and standard deviation from n=3 (<150uM) and n=2 (≥150uM) independent experiments. Points without errors bars have standard deviations too small to show.
(B) Volume-normalized reaction rates of FRB-polySH35-polyPRM5 droplets (black) and droplet equivalent concentration (DEC, red). Error bars represent SEM from 6 independent experiments. Statistical significance was assessed by a two-tailed, unpaired Student’s t-test with a p-value cutoff of 0.05. Droplet rate was determined from the difference between the average total reaction rate and average bulk reaction rate, with errors propagated accordingly.
(C) Droplet:DEC rate ratio of FRB-polySH35-polyPRM5 droplets at total RanGAP* concentrations of 0.5 µM (black), 1 µM (blue), and 2 µM (green), corresponding to droplet concentrations of ~9 µM, ~32 µM, and ~40 µM, respectively. Error bars represent SEM from n=4, n=6, and n=3 independent experiments, respectively. Statistical significance was assessed by unpaired one way ANOVA with a p-value cutoff of 0.05.
(D) Fluorescence emission spectrum of FKBP-YPet-RanGAP* upon 445nm excitation of CyPet-FKBP-E2. Spectra recorded in the presence of FRB-polySH35 (black circles), FRB-polySH35 + polyPRM5 (cyan squares), FRB-polySH33 (magenta triangles) or FRB-polySH33 + polyPRM5 (inverted red triangles). Each point represents the mean and SD (error bars) of 2 independent experiments.
All figure panels have associated raw data.
