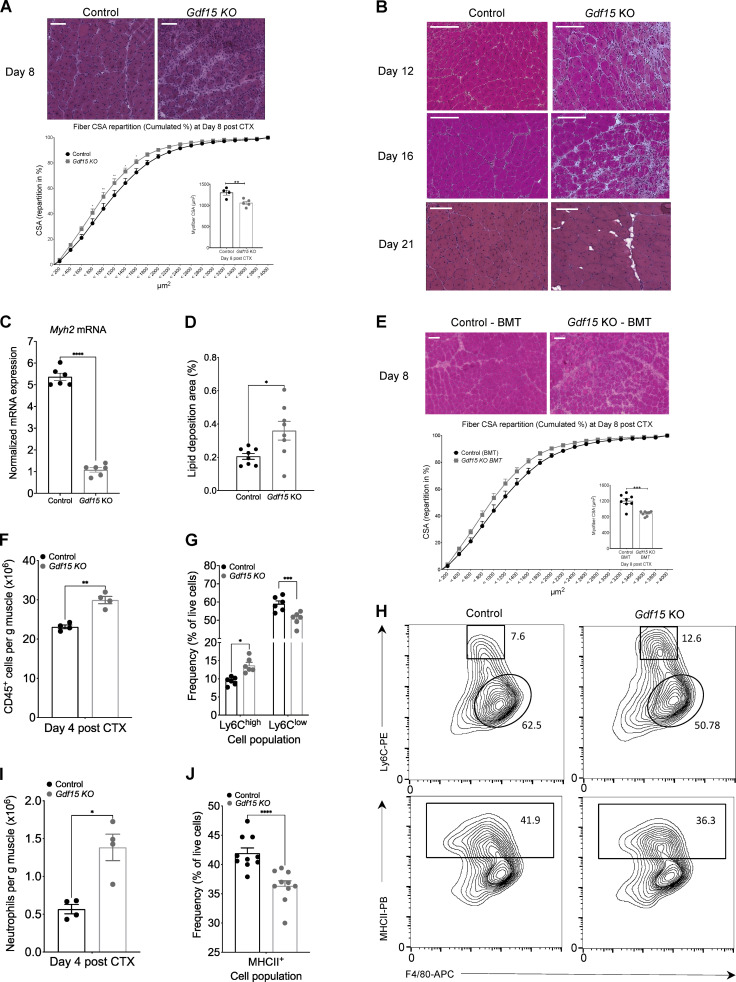
Figure 3.
GDF-15 deficiency leads to impaired muscle regeneration and impacts the MF phenotype switch. (A) Top: Representative images of H&E-stained skeletal muscle (TA) from WT-control and Gdf15 KO animals at day 8 after CTX-induced injury. Scale bars in the upper left corner represent 100 µm. Bottom: Fiber size repartition of regenerating muscle in WT-control and Gdf15 KO animals at day 8 after CTX injury (two-way ANOVA with multiple comparison test). Inset shows the average fiber CSA of regenerating muscle at day 8 after CTX injury (n = at least 4 mice per group). (B) Representative images of H&E-stained skeletal muscle (TA) from WT-control and Gdf15 KO animals at days 12, 16, and 21 after CTX-induced injury. Scale bars in the upper left corner represent 100 µm. (C) Myh2 mRNA expression in WT-control and Gdf15 KO muscles at day 8 after CTX injury (n = 6 muscles per group). Myh2 was normalized over Rpl32 (n = 3 independent experiments). (D) Percentage of ectopic lipid deposition relative to the muscle regeneration area at day 21 of regeneration in WT-control and Gdf15 KO muscles is shown (n = 8 mice per group). (E) Top: Representative images of H&E-stained TA skeletal muscle 8 d after CTX injury from chimeric WT BoyJ BMT animals (CD45.1 recipients) that received either WT (CD45.2) or Gdf15 KO BM. Scale bars in the upper left corner represent 100 µm. Bottom: Cumulated myofiber CSA repartition (two-way ANOVA with multiple comparison test) and mean CSA (inset) at day 8 after CTX injury from BMT animals (n = at least 8 mice per group, two-way ANOVA). (F) Number of infiltrating myeloid (CD45+) cells in regenerating muscle from WT-control and Gdf15 KO muscles at day 4 after CTX injury (n = 4 mice per group). (G) Frequency (in %) of CD45+ inflammatory (Ly6Chigh F4/80low) and repair (Ly6Clow F4/80high) MFs from WT-control and Gdf15 KO mice at day 4 following CTX injury (n = 6 mice per group). (H) Representative flow cytometry 10% quantile contour plots of inflammatory and repair MFs from WT-control and Gdf15 KO at day 4 after CTX injury. Shapes indicate the gating used for cell frequency quantification (square = Ly6Chigh inflammatory MFs, circle = Ly6Clow repair MFs, rectangle = MHCII+ MFs). Representative frequencies for each cell population are shown adjacent on inside each gate. x and y axis numbers indicate the fluorescence intensity (on the log10 scale) of the indicated fluorescent-labeled antibodies for all the plotted events. PB, Pacific Blue; APC, allophycocyanin. (I) Number of infiltrating neutrophils (CD45+ Ly6G+ Ly6Cint F4/80−) cells in regenerating muscle from WT-control and Gdf15 KO muscles at day 4 after CTX injury (n = 4 mice per group). (J) Frequency (in %) of CD45+ F4/80+ MHCII+ MFs from WT-control and Gdf15 KO mice at day 4 following CTX injury (n = 10 mice per group). In all bar graphs, bars represent mean ± SEM. Exact P values were determined using unpaired Student’s t test unless otherwise noted. *, P < 0.05; **, P < 0.01; ***, P < 0.001; ****, P < 0.0001. PE, phycoerythrin.

