Figure 4.
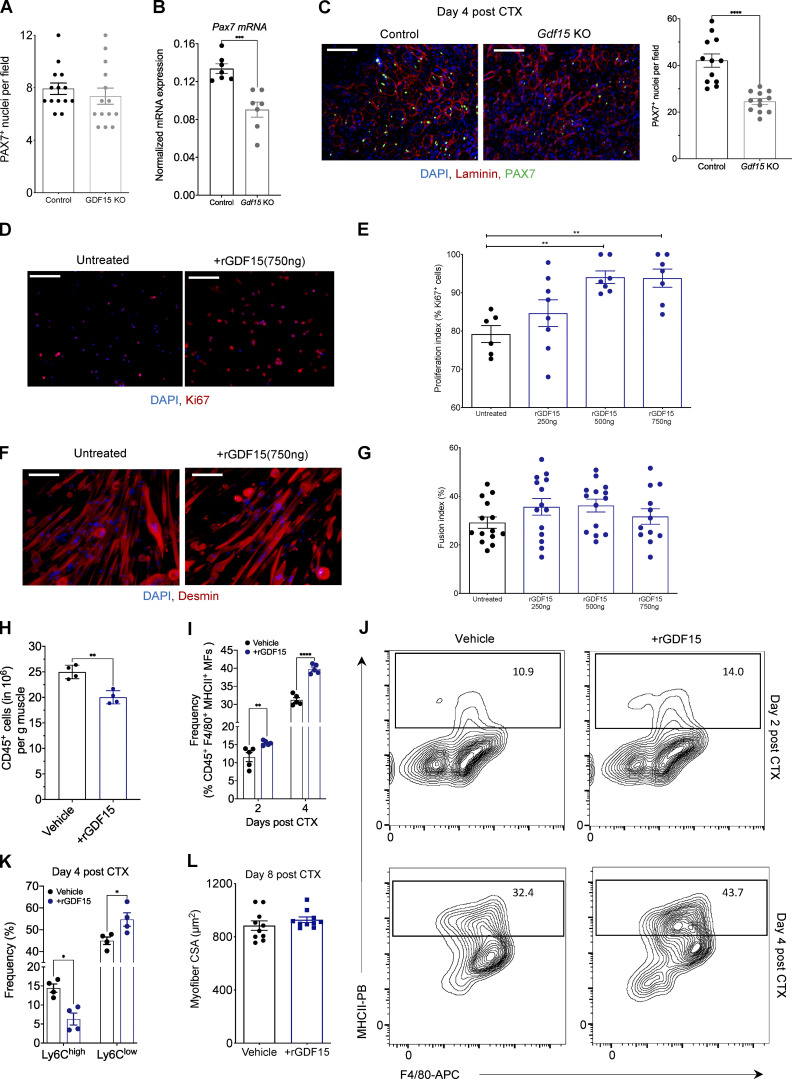
Effects of recombinant GDF-15 on muscle progenitor proliferation in vitro and MHCII expression of muscle MFs in vivo. (A) Number of PAX7+ cells in uninjured TA muscles of WT-control and Gdf15 KO (n = 14 muscles per group). (B) Quantification of Pax7 gene expression (mRNA) using qPCR in WT-control and Gdf15 KO muscles at day 4 after CTX injury (n = 6 or 7 biological replicates per group). Pax7 was normalized over Rpl32. (C) Left: Representative images of IHC detection of laminin (red), PAX7 (green), and nuclei (blue) in WT-control and Gdf15 KO at day 4 after CTX injury. Scale bars in the upper left corner represent 100 µm. Right: Number of PAX7+ cells in WT-control and Gdf15 KO at day 4 after CTX injury (n = 12 muscles per group). (D) Ki67 (red) and DAPI (blue) immunofluorescence staining shows a robust increase in myoblast proliferation in the presence of rGDF-15 in primary myoblasts. Representative images from untreated and 750 ng/ml rGDF-15–treated myoblasts are shown. Scale bars in the upper left corner represent 100 μm. (E) Proliferation index of primary myoblasts in the presence of indicated concentrations of recombinant GDF-15 (n = at least 6 independent experiments). (F) Immunofluorescence against Desmin (red) and DAPI (blue) shows no difference in myotube formation in the presence of rGDF-15 in primary myoblasts (n = 12 independent experiments). Representative images from untreated and 750 ng/ml rGDF-15–treated myoblasts are shown. Scale bars in the upper left corner represent 100 μm. (G) Fusion index of primary myoblasts in the presence of various concentrations of recombinant GDF-15 (n = at least 6 independent experiments). (H) Number of infiltrating CD45+ cells in TA muscle of WT mice administered with saline (control) or rGDF-15 (30 µg/kg intramuscularly) at day 2 after CTX injury (n = 4 biologically independent samples per treatment group). (I) Frequency (in %) of CD45+ F4/80+ MHCII+ MFs from saline (control) and rGDF-15–treated animals at indicated time points following CTX injury (n = 5 mice per group). (J) Representative flow cytometry 10% quantile contour plots of CD45+ F4/80+ MHCII+ MFs from vehicle (saline) and rGDF-15–treated animals at days 2 and 4 after CTX injury. Images represent four independent experiments with similar results. x and y axis numbers indicate the fluorescence intensity (on the log10 scale) of the indicated fluorescent-labeled antibodies for all the plotted events. PB, Pacific Blue; APC, allophycocyanin. (K) Frequency (in %) of inflammatory (Ly6Chigh F4/80low) and repair (Ly6Clow F4/80high) MFs from vehicle (saline) and rGDF-15–treated (30 µg/kg intramuscularly) animals at day 4 following CTX injury (n = 5 mice per group). (L) Average fiber CSA of regenerating muscle in saline (control) and rGDF-15–treated (30 µg/kg intramuscularly at day 4) animals at day 8 after CTX injury (n = 10 per group). In all bar graphs, bars represent mean ± SEM. Exact P values were determined using unpaired Student’s t test or ANOVA to compare three or more groups, *, P < 0.05; **, P < 0.01; ***, P < 0.001; ****, P < 0.0001.

