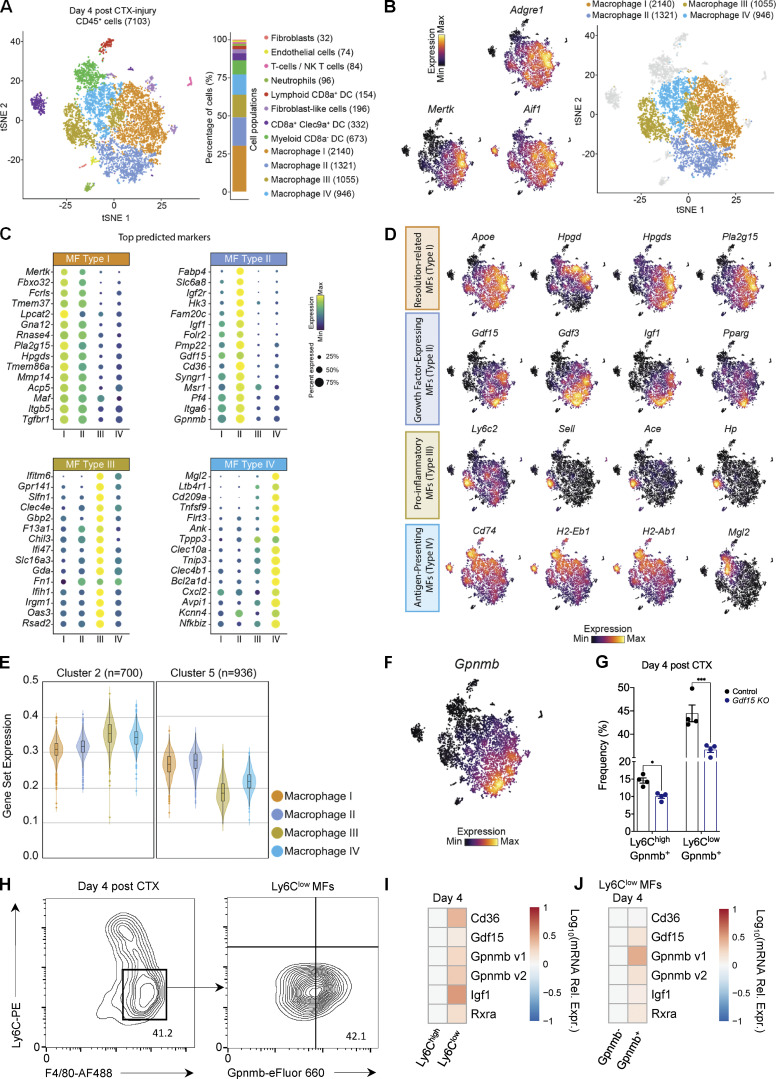
Figure 7.
scRNA-seq analysis of CD45+ cells at day 4 after injury reveals the myeloid cell source of GDF-15. (A) Single-cell transcriptomes derived from CD45+ cells isolated from injured TA muscle at day 4 after CTX injury. A total number of 7,103 cells expressing 16,979 different genes were used for the downstream analysis. Data are presented as a t-distributed stochastic neighbor embedding (tSNE) projection to visualize variation in single-cell transcriptomes. Unsupervised SNN clustering resolved at least 12 distinct types of cells (color-coded in legend) and was achieved using a hierarchical tree algorithm (Seurat’s Leiden algorithm). Identification of cell types from SNN clusters was based on cluster-average expression of canonical genes included in the EnrichR Mouse Gene Atlas (Chen et al., 2013; Kuleshov et al., 2016). The composition of cell types presented as a percentage, as well as the absolute number of cells per identified cluster, are shown on the right. The cumulatively largest and most ambiguous group are F4/80+ MFs (consisting of 76.9% of the total single-cell transcriptomes). (B) Left: Feature plots of classical MF-defining markers (Adgre1, Aif1, MerTK) across all cells (row Z-score). Right: tSNE plot of single-cell transcriptomes representing the clusters of only the F4/80 (Adgre1)+ cells. (C) Top 15 marker genes for the four identified MF clusters. The dot size represents the percentage of cells within a group with an expression level >0, and color-scale represents the average expression level (row Z-score) across all cells within the cluster (determined by nonparametric Wilcoxon rank-sum test). (D) Single-cell expression levels (row Z-score) for selected functional MF markers based on prior literature (Varga et al., 2016a; Varga et al., 2016b; Tidball, 2017; Chazaud, 2020). These markers allowed delineation of four functionally distinct MF subtypes at day 4 after injury. (E) Average expression of all genes included in the RPPs of clusters 2 and 5 (defined in Fig. 1 E) in the four MF subtypes identified by scRNA-seq analysis. Cluster 2 genes (700 out of 716) with a stably decreasing expression pattern show a predominance for MF type III (functionally annotated as a pro-inflammatory subtype), while cluster 5 genes (936 out of 952) with a stably increasing expression pattern along the regeneration time course show a predominance for MF type I and II (functionally annotated as resolution-related and growth factor–expressing subtypes, respectively). (F) Feature plot of Gpnmb expression (row Z-score) defining the MF type II that corresponds to the functionally annotated GFEM subtype. (G) Frequency (in %) of CD45+ inflammatory (Ly6G− Ly6Chigh F4/80low GPNMB+) and repair (Ly6G− Ly6Clow F4/80high GPNMB+) MFs from WT-control and Gdf15 KO mice at day 4 following CTX injury (n = 4 mice per group). Bars represent mean ± SEM. Exact P values were determined using unpaired Student’s t test. *, P < 0.05; ***, P < 0.001. (H) Representative FACS 10% quantile contour plots and gating strategy of CD45+ Ly6Clow GPNMB+ F4/80+ MFs at day 4 after CTX in control mice, representing the GFEM subtype. x and y axis numbers indicate the fluorescence intensity (on the log10 scale) of the indicated fluorescent-labeled antibodies for all the plotted events. AF488, Alexa Fluor 488. (I and J) Heatmaps showing the relative mRNA expression (assessed by qPCR and visualized as log relative expression [Rel. Expr.] values over Ppia) pattern of GFEM predicted marker genes in (I) Ly6Chigh or Ly6Clow muscle-infiltrating MFs and (J) FACS-sorted CD45+ Ly6Clow GPNMB+ F4/80+ and CD45+ Ly6Clow GPNMB− F4/80+ MFs. mRNA expression values reflect the average of three biological replicates per population. “Gpnmb v1” and “Gpnmb v2” reflect two separate primer sets targeting different exons of the Gpnmb gene.

