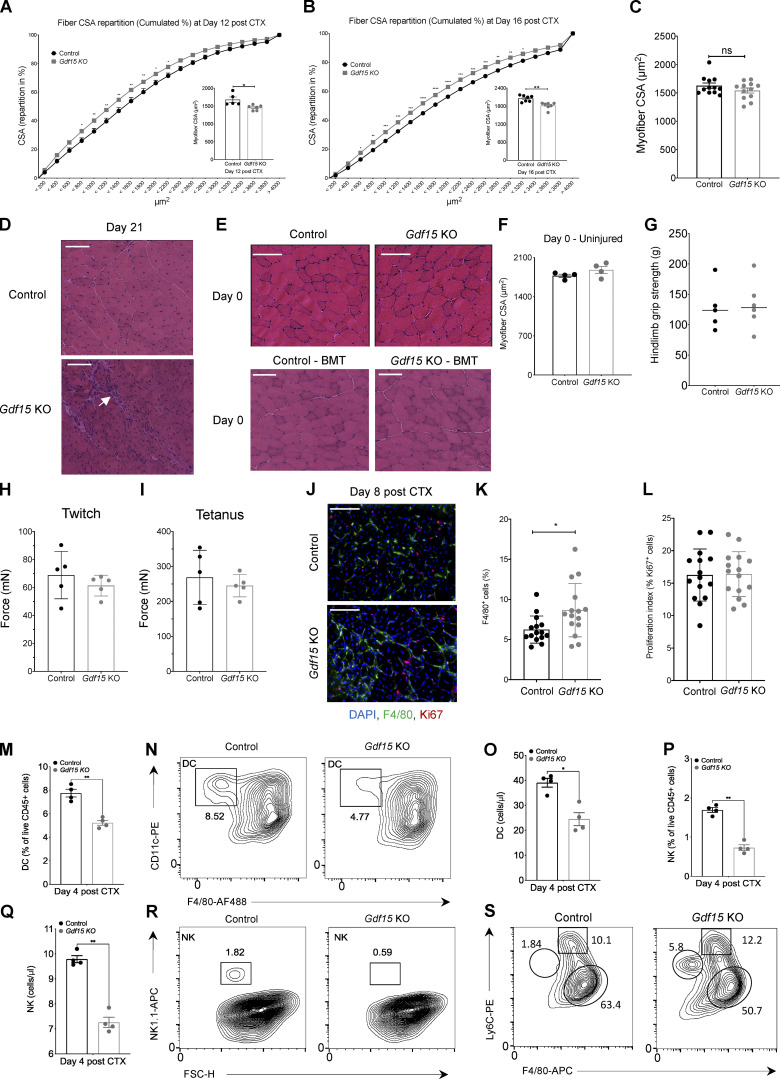
Figure S4.
GDF-15 ablation allows normal muscle development and muscle growth in uninjured animals (related to Fig. 3). (A and B) Fiber size repartition of regenerating muscle in WT-control and Gdf15 KO mice at days 12 (A) and 16 (B) after CTX injury (two-way ANOVA with multiple comparison test). Insets show the average fiber CSA of regenerating muscle at indicated time points after CTX injury (n = at least 5 mice per group). (C) Average fiber CSA of regenerating muscle in WT-control and Gdf15 KO mice at day 21 after CTX injury (n = 12 muscles per group). (D) Representative images of increased infiltration in H&E-stained skeletal muscle (TA) from WT-control and Gdf15 KO animals at day 21 after CTX-induced injury. Arrow indicates area of persistent immune cell infiltration. Scale bars in the upper left corner represent 100 µm. (E) Top: Representative images of H&E-stained skeletal muscle (TA) from uninjured WT-control and Gdf15 KO animals. Bottom: Representative images of H&E-stained skeletal muscle (TA) from uninjured control–BMT and Gdf15 KO–BMT chimeras. Scale bars in the upper left corner represent 100 µm. (F) Average fiber CSA of uninjured muscle in WT-control and Gdf15 KO animals (n = 4 mice per group). (G) In vivo hindlimb grip strength in uninjured WT-control and Gdf15 KO adult male mice. Mean of five measurements per mouse is plotted (n = 6 mice per group). (H) Quantification of in vivo muscle twitch force in uninjured WT-control and Gdf15 KO mice (n = 5 mice per group). (I) Quantification of in vivo muscle tetanus force in uninjured WT-control and Gdf15 KO mice (n = 5 mice per group). (J) Representative immunofluorescence images of regenerating muscles in WT-control and Gdf15 KO animals at day 8 after injury (red marks proliferation marker Ki67, green marks MF marker F4/80, and blue indicates nuclei). Scale bars in the upper left corner represent 100 µm. (K) Increased presence of F4/80+ cells in the Gdf15 KO at day 8 after CTX. Values are expressed as percentage of total cells (n = 15 representative fields of view per group). (L) Quantification shows the proliferation index of F4/80+ cells. The values represent the percentage of Ki67+ cells over F4/80+ cells in the respective field of view (n = 15 representative fields of view per group). (M) Frequency (in %) of DCs from WT-control and Gdf15 KO mice at day 4 following CTX injury (n = 4 animals per group). x and y axis numbers indicate the fluorescence intensity (on the log10 scale) of the indicated fluorescent-labeled antibodies for all the plotted events. (N) Representative FACS contour plots of DCs (gated as CD45+ CD11c+ F4/80− Ly6G-MHCII+) at day 4 after CTX in WT-control and Gdf15 KO animals. x and y axis numbers indicate the fluorescence intensity (on the log10 scale) of the indicated fluorescent-labeled antibodies for all the plotted events. AF488, Alexa Fluor 488. (O) Absolute number of infiltrating DCs in regenerating muscle from WT-control and Gdf15 KO muscles at day 4 after CTX injury using counting beads (n = 4 animals per group). (P) Frequency (in %) of NK cells from WT-control and Gdf15 KO mice at day 4 following CTX injury (n = 4). (Q) Absolute number of infiltrating NK cells in regenerating muscle from WT-control and Gdf15 KO muscles at day 4 after CTX injury using counting beads (n = 4 animals per group). (R) Representative FACS analysis of NK cells (gated as CD45+ F4/80− Ly6G− Nk1.1+) at day 4 after CTX in control and Gdf15 KO animals. y axis numbers indicate the fluorescence intensity (on the log10 scale) of the indicated fluorescent-labeled antibody for all the plotted events. x axis scale is an arbitrary linear scale representing increasing intensity of forward scatter (FSC) signal. APC, allophycocyanin. (S) Representative flow cytometry contour plots of inflammatory and repair MFs (without excluding Ly6G+ cells) from WT-control and Gdf15 KO at day 4 after CTX injury. Shapes indicate the gating used for cell frequency quantification (circle = neutrophils, square = Ly6Chigh inflammatory MFs, oval = Ly6Clow repair MFs). Representative frequencies for each cell population are shown adjacent on inside each gate. x and y axis numbers indicate the fluorescence intensity (on the log10 scale) of the indicated fluorescent-labeled antibodies for all the plotted events. APC, allophycocyanin; PE, phycoerythrin. In all graphs, bars and lines represent mean ± SEM. Exact P values were determined using unpaired Student’s t test unless otherwise noted. *, P < 0.05; **, P < 0.01.

