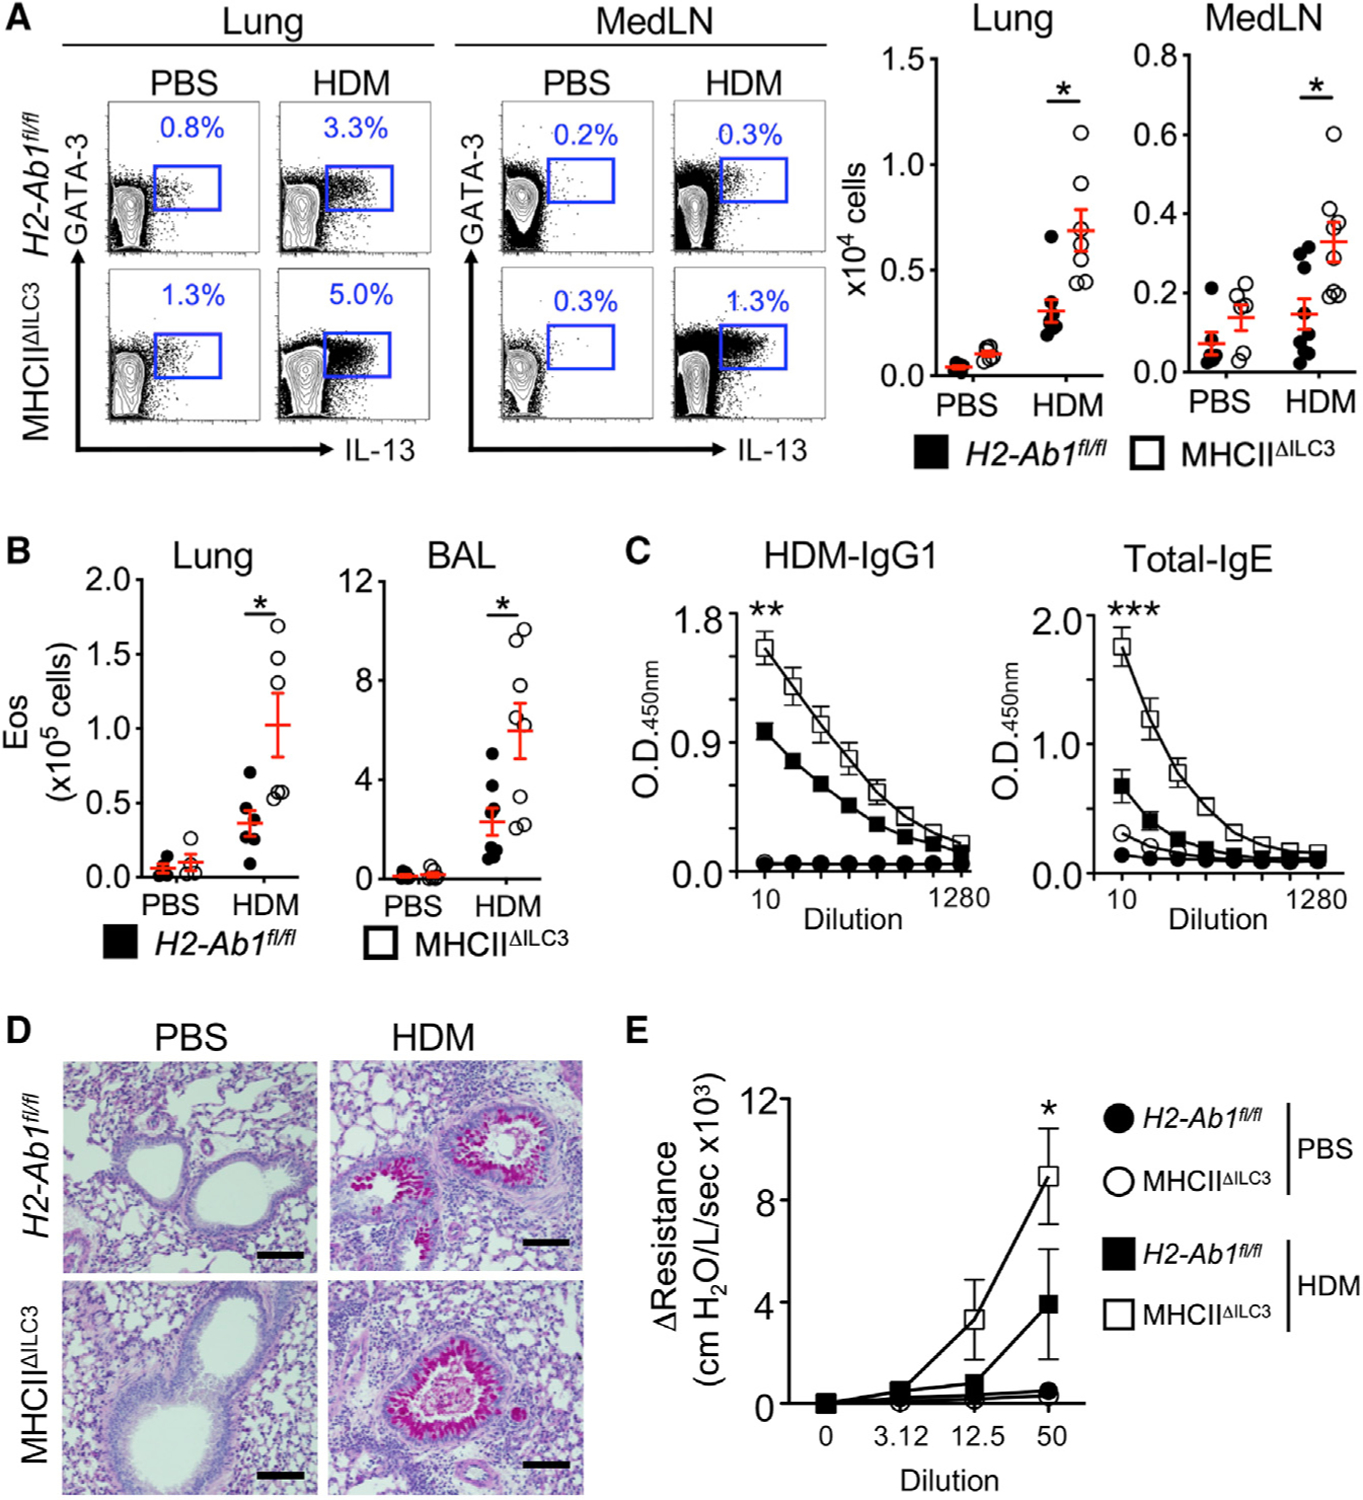
Figure 3. MHC class II+ ILC3s limit Th2 cell responses and allergic airway inflammation.

(A) Representative plots and quantitative graphs of the frequency and number of Th2 cells in lung parenchyma and MedLN from H2-Ab1fl/fl control mice and MHC class IIΔILC3 mice after exposure to HDM or PBS. Cells were gated on live CD45+ CD19− CD3/CD5+ CD4+ (data pooled from 4 independent assays).
(B) Quantitative graphs of the numbers of eosinophils in lung parenchyma and BAL from mice in (A). Eosinophils were identified as live CD45+ SSC-Ahi, Siglec-F+ (data pooled from 4 independent assays, n = 8).
(C) ELISA analysis of sera from mice in (A) for HDM-specific IgG1 and total IgE (pooled from 2 independent assays, n = 4).
(D) Representative periodic acid-Schiff staining sections from lung of mice in (A). The scale bars represent 100 μm.
(E) Analysis of airway resistance on mice from (A) (pooled from 2 independent assays, n = 8). Data are represented as mean ± SEM. Statistics are calculated by two-way ANOVA (A and B) and AUC followed by one-way ANOVA (C and E). See also Figure S3.
