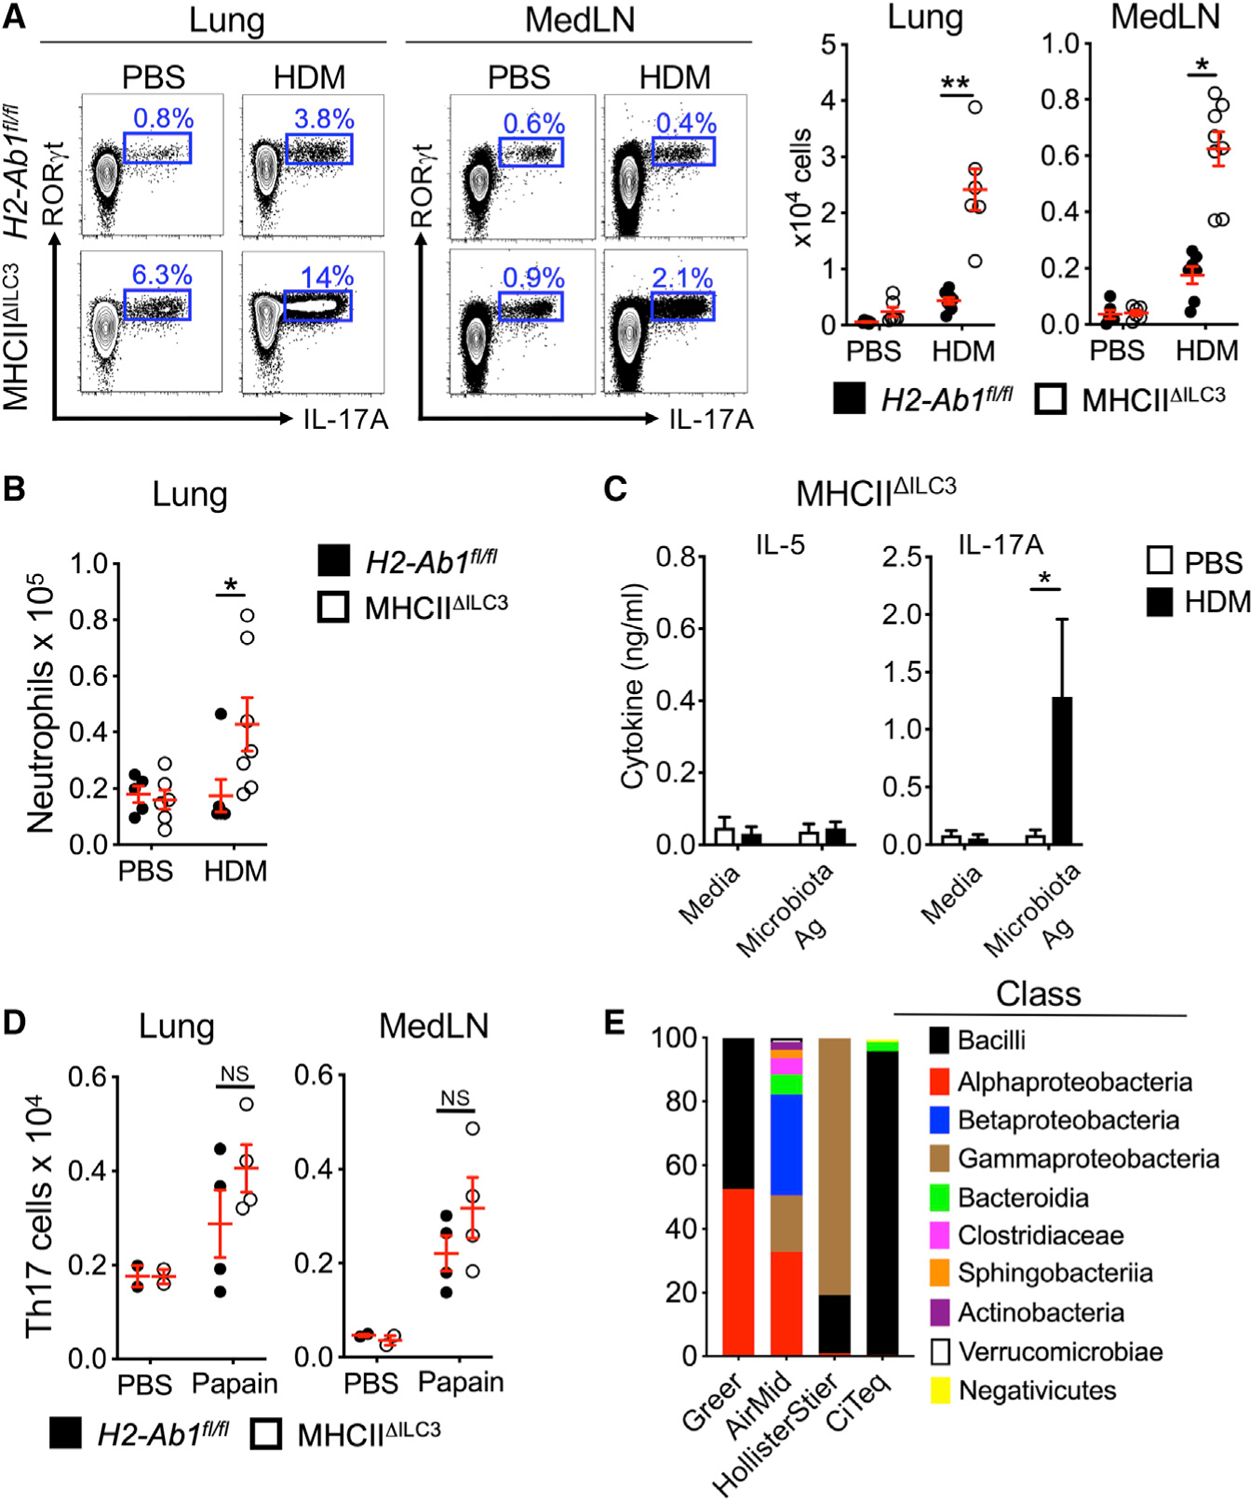
Figure 4. MHC class II+ ILC3s limit airway Th17 cell responses to microbes upon HDM exposure.

(A) Representative plots and quantitative graphs of the frequency and number of Th17 cells in lung parenchyma and MedLN from H2-Ab1fl/fl control mice and MHC class IIΔILC3 mice after exposure to HDM or PBS. Cells were gated on live CD45+ CD19− CD3/CD5+ CD4+ (data pooled from 4 independent assays, n = 6).
(B) Quantitative graph of the number of neutrophils in lung parenchyma from mice in (A). Neutrophils were identified as live CD45+ CD19− TCRβ− CD11b+ Ly6G+ (data pooled from 4 independent assays, n = 7).
(C) ELISA analysis for IL-5 and IL-17A levels from supernatants of microbiota-extract-restimulated MedLN cells from HDM-exposed MHC class IIΔILC3 mice (data pooled from 2 independent assays).
(D) Quantitative graphs of the number of Th17 cells in lung parenchyma and MedLNs from H2-Ab1fl/fl control mice and MHC class IIΔILC3 mice after exposure to sterile papain (data pooled from 2 independent assays, n = 4).
(E) Bar graphs of major bacterial composition in HDM from four different vendors. Data are represented as mean ± SEM. Statistics are calculated by two-way ANOVA. See also Figure S4.
