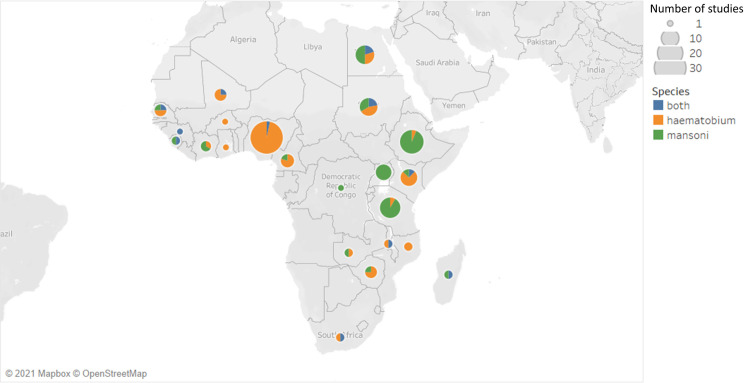
Fig 2. Map showing the geographical distribution across Africa of all papers included in this final review (n = 128).
The size of each marker is proportional to the total number of studies conducted in each country and the colour corresponds to the species. This map was created using our data and the Tableau software [21]. Mapbox and OpenStreetMap are available by default in the Tableau Software Map Layers pane. Each Tableau software map built-in includes acknowledgements of Mapbox (https://www.mapbox.com/tableau/) and OpenStreetMap (https://www.openstreetmap.org/). OpenStreetMap is free to use under an open license.

