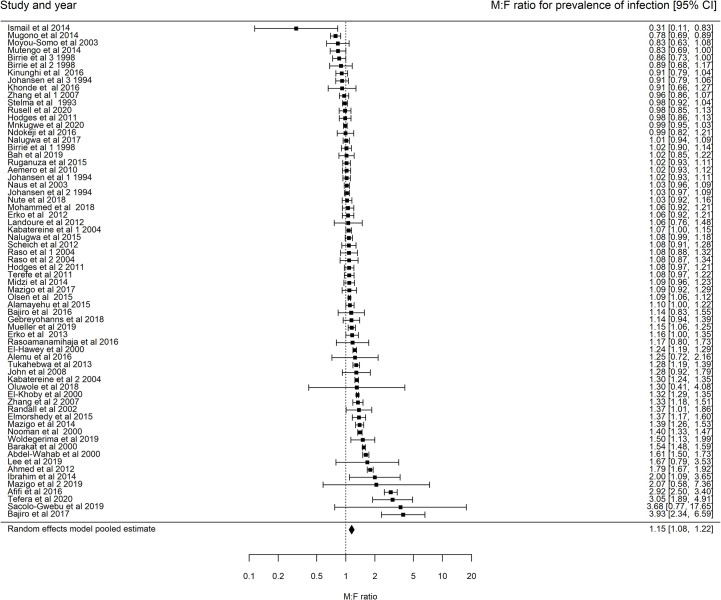
Fig 5. Forest plots showing the M:F prevalence of infection ratios and 95% CI for Schistosoma mansoni (66 communities and n = 61 studies, pooled M:F prevalence ratio is (1.15, 95% CI 1.08–1.22), heterogeneity: I2 = 96.43%).
Points further to the right indicate higher prevalence in males. Analysis includes studies that report the number of males and females who were screened for S. mansoni infection and the fraction who tested positive regardless of the reported significance of the difference in M:F prevalence of infection ratio.

